Insights into equilibrium dynamics of proteins from comparison of NMR and X-ray data with computational predictions - PubMed (original) (raw)
Comparative Study
Insights into equilibrium dynamics of proteins from comparison of NMR and X-ray data with computational predictions
Lee-Wei Yang et al. Structure. 2007 Jun.
Abstract
For a representative set of 64 nonhomologous proteins, each containing a structure solved by NMR and X-ray crystallography, we analyzed the variations in atomic coordinates between NMR models, the temperature (B) factors measured by X-ray crystallography, and the fluctuation dynamics predicted by the Gaussian network model (GNM). The NMR and X-ray data exhibited a correlation of 0.49. The GNM results, on the other hand, yielded a correlation of 0.59 with X-ray data and a distinctively better correlation (0.75) with NMR data. The higher correlation between GNM and NMR data, compared to that between GNM and X-ray B factors, is shown to arise from the differences in the spectrum of modes accessible in solution and in the crystal environment. Mainly, large-amplitude motions sampled in solution are restricted, if not inaccessible, in the crystalline environment of X-rays. Combined GNM and NMR analysis emerges as a useful tool for assessing protein dynamics.
Figures
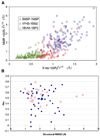
Figure 1. Comparison of Rmsd from Mean Positions Observed in Solution NMR and in X-Ray Crystallographic Experiments
(A) <(ΔRi)2>1/2NMR values corresponding to the NMR structures for motile sperm protein (PDB ID code 3MSP), SRC homology domain (PDB ID code 1FHS), and bovine pancreatic phospholipase (PDB ID code 1BVM) arecompared with those, <(ΔRi)2>1/2X-ray, reported for their X-ray counterparts PDB ID codes1MSP, 1BM2, and1BP2, respectively. Each point represents the rms variations in the position of a given Cα atom inferred from NMR and X-ray data. The results for all the aligned residues of the 64 protein pairs (not shown for clarity) yield the linear regression equation <(ΔRi)2>1/2NMR = 2.22 <(ΔRi)2>1/2X-ray − 0.49; that is, the NMR models exhibit, on average, rms fluctuations twice as large as those observed in X-ray structures. (B) The correlation coefficients σNX for residue fluctuations in the two experimental data sets for each protein plotted against the corresponding structural rmsds (rmsdN−X) for the NMR and X-ray structures. The mean correlation coefficient averaged over all proteins and its standard deviation is <σNX> = 0.485 ± 0.022, with a standard deviation of 0.178. The correlation coefficients exhibit no detectable dependence on rmsdN−X.
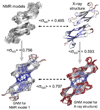
Figure 2. Overview of the Calculation Scheme Conducted for All Proteins, Illustrated for Motile Major Sperm Protein from Ascaris suum
MSP is a dimeric β protein solved by NMR (Haaf et al., 1998) and X-ray (Bullock et al., 1996). The upper two structures depict the NMR models (left) and the X-ray structure (right) (PDB ID codes 3MSP and 1MSP, respectively). The X-ray structure is color coded according to the B factors reported in the PDB. The lower two diagrams are the GNM representations of the respective structures, color coded according to mobilities, from blue to red with increasing sizes of motions. The average correlation coefficients between the residue fluctuations derived from experimental data (rmsds between NMR models or B factors) or computed by the GNM are indicated by the <σ> values (see also Table 1).
Figure 3. Schematic Description of the Calculation Scheme Adopted in the Present Study
(A) <(ΔRi)2>NMR, the rmsd between the 20 NMR models (in the left diagram) deposited for MSP shown as a function of residue index 1 ≤ i ≤ 252. (B) Rms fluctuations, <(ΔRi)2>1/2X-ray, revealed by the B factors in the X-ray structure of MSP (i.e., as a function of residue index i). (C and D) Rms fluctuations computed by the GNM for the NMR structure, <(ΔRi)2>GNM-N (C), and rms fluctuations computed by the GNM for the crystal structure, <(ΔRi)2>1/2GNM-X (D). The two middle plots show the comparison of the experimental and theoretical results for the NMR (left) and X-ray (right) models. The correlation coefficient, σNG, between <(ΔRi)2>1/2NMR and <(ΔRi)2>1/2GNM-N is 0.909 (left), and that, σXG, between <(ΔRi)2>1/2 X-ray and <(ΔRi)2>1/2GNM-X is 0.596 (right). PDB ID codes 3MSP and 1MSP share 100%sequence identity and rmsd of 1.45 Å for the Cα atoms.
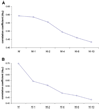
Figure 4. Variation in <σXG> and <σNG> as a Function of the Number of Excluded GNM Slow Modes, Averaged over All 64 Protein Pairs
The abscissa indicates the number of modes taken into consideration. N′ refers to the complete set of nonzero modes; N′ – k refers to all modes except the slowest k modes. Note that the differences in average correlation coefficients as a function of the number of included modes included are statistically significant, with the exception of that between the N and N – 1 values for σXG, verified by paired Student’s t test. (A) Excluding the contribution of the slowest GNM mode does not decrease the correlation <σXG>, whereas additional removal of slow modes from the computations reduces the correlation with X-ray results. (B) Excluding the slowest GNM modes significantly decreases the correlation <σNG> with the NMR rmsd data.
Figure 5. Backbone Cα Rmsds for Three Different Structural Ensembles of the IgG Binding Domain, PDB ID Code 3GB1, Structures
Structure I (black, solid) was determined with the complete set of NOE restraints; structure II (red, solid), by excluding the Leu5-Thr16 restraints; structure III (green, solid), by excluding the Leu5-Phe52 restraints. The GNM prediction (purple, dashed) is based on the first model of structure I. The average Cα rmsd in structures I, II, and III are 3.2, 3.3 (2% increase), and 4.3 Å (34% increase), respectively. The correlations between the rmsd values for structures I, II, and III and the corresponding GNM results are 0.78, 0.74, and 0.70, respectively. In addition, the correlation between the GNM-predicted fluctuation profiles of structures I and II is 0.96, of structures I and III is 0.98, and of structures II and III is 0.91. The restraints included or excluded in the refinement are listed in Supplemental Data.
Similar articles
- A large-scale comparison of computational models on the residue flexibility for NMR-derived proteins.
Zhang H, Shi H, Hanlon M. Zhang H, et al. Protein Pept Lett. 2012 Feb;19(2):244-51. doi: 10.2174/092986612799080301. Protein Pept Lett. 2012. PMID: 21933137 - A comparative analysis of the equilibrium dynamics of a designed protein inferred from NMR, X-ray, and computations.
Liu L, Koharudin LM, Gronenborn AM, Bahar I. Liu L, et al. Proteins. 2009 Dec;77(4):927-39. doi: 10.1002/prot.22518. Proteins. 2009. PMID: 19688820 Free PMC article. - Escherichia coli adenylate kinase dynamics: comparison of elastic network model modes with mode-coupling (15)N-NMR relaxation data.
Temiz NA, Meirovitch E, Bahar I. Temiz NA, et al. Proteins. 2004 Nov 15;57(3):468-80. doi: 10.1002/prot.20226. Proteins. 2004. PMID: 15382240 Free PMC article. - A community resource of experimental data for NMR / X-ray crystal structure pairs.
Everett JK, Tejero R, Murthy SB, Acton TB, Aramini JM, Baran MC, Benach J, Cort JR, Eletsky A, Forouhar F, Guan R, Kuzin AP, Lee HW, Liu G, Mani R, Mao B, Mills JL, Montelione AF, Pederson K, Powers R, Ramelot T, Rossi P, Seetharaman J, Snyder D, Swapna GV, Vorobiev SM, Wu Y, Xiao R, Yang Y, Arrowsmith CH, Hunt JF, Kennedy MA, Prestegard JH, Szyperski T, Tong L, Montelione GT. Everett JK, et al. Protein Sci. 2016 Jan;25(1):30-45. doi: 10.1002/pro.2774. Epub 2015 Sep 22. Protein Sci. 2016. PMID: 26293815 Free PMC article. Review. - Macromolecular structure determination by NMR spectroscopy.
Markley JL, Ulrich EL, Westler WM, Volkman BF. Markley JL, et al. Methods Biochem Anal. 2003;44:89-113. Methods Biochem Anal. 2003. PMID: 12647383 Review. No abstract available.
Cited by
- A flexible docking scheme to explore the binding selectivity of PDZ domains.
Gerek ZN, Ozkan SB. Gerek ZN, et al. Protein Sci. 2010 May;19(5):914-28. doi: 10.1002/pro.366. Protein Sci. 2010. PMID: 20196074 Free PMC article. - Coarse-grained models reveal functional dynamics--I. Elastic network models--theories, comparisons and perspectives.
Yang LW, Chng CP. Yang LW, et al. Bioinform Biol Insights. 2008 Mar 4;2:25-45. doi: 10.4137/bbi.s460. Bioinform Biol Insights. 2008. PMID: 19812764 Free PMC article. - Coexistence of flexibility and stability of proteins: an equation of state.
de Leeuw M, Reuveni S, Klafter J, Granek R. de Leeuw M, et al. PLoS One. 2009 Oct 9;4(10):e7296. doi: 10.1371/journal.pone.0007296. PLoS One. 2009. PMID: 19816577 Free PMC article. - Identification of Hot Spots in Protein Structures Using Gaussian Network Model and Gaussian Naive Bayes.
Zhang H, Jiang T, Shan G. Zhang H, et al. Biomed Res Int. 2016;2016:4354901. doi: 10.1155/2016/4354901. Epub 2016 Nov 2. Biomed Res Int. 2016. PMID: 27882325 Free PMC article. - Protein flexibility in docking and surface mapping.
Lexa KW, Carlson HA. Lexa KW, et al. Q Rev Biophys. 2012 Aug;45(3):301-43. doi: 10.1017/S0033583512000066. Epub 2012 May 9. Q Rev Biophys. 2012. PMID: 22569329 Free PMC article. Review.
References
- Bahar I, Atilgan AR, Erman B. Direct evaluation of thermal fluctuations in proteins using a single-parameter harmonic potential. Structure. 1997;2:173–181. - PubMed
- Billeter M. Comparison of protein structures determined by NMR in solution and by X-ray diffraction in single crystals. Q. Rev. Biophys. 1992;25:325–377. - PubMed
- Brünger AT. X-ray crystallography and NMR reveal complementary views of structure and dynamics. Nat. Struct. Biol. 1997;4:862–865. - PubMed
Publication types
MeSH terms
Substances
Grants and funding
- R33 GM 068400-01/GM/NIGMS NIH HHS/United States
- R33 GM068400-03/GM/NIGMS NIH HHS/United States
- R01 LM 007994-01/LM/NLM NIH HHS/United States
- R01 LM007994-05/LM/NLM NIH HHS/United States
- R01 LM007994/LM/NLM NIH HHS/United States
- R33 GM068400/GM/NIGMS NIH HHS/United States
LinkOut - more resources
Full Text Sources


