Downregulation of class I major histocompatibility complex surface expression by varicella-zoster virus involves open reading frame 66 protein kinase-dependent and -independent mechanisms - PubMed (original) (raw)
Downregulation of class I major histocompatibility complex surface expression by varicella-zoster virus involves open reading frame 66 protein kinase-dependent and -independent mechanisms
Amie J Eisfeld et al. J Virol. 2007 Sep.
Abstract
We show here that the varicella-zoster virus (VZV) open reading frame 66 (ORF66) protein kinase is one mechanism employed to reduce class I major histocompatibility complex (MHC-I) surface expression in VZV-infected cells. Cells expressing enhanced green fluorescent protein-tagged functional and inactivated ORF66 (GFP-66 and GFP-66kd) from replication-defective adenovirus vectors revealed that ORF66 reduced MHC-I surface levels in a manner dependent on kinase activity. Cells infected with recombinant VZV expressing GFP-66 exhibited a significantly greater reduction in MHC-I surface expression than that observed in cells infected with VZV disrupted in GFP-66 expression. MHC-I maturation was delayed in its transport from the endoplasmic reticulum through the Golgi in both adenovirus-transduced cells expressing only GFP-66 and in VZV-infected cells expressing high levels of GFP-66, and this was predominantly kinase dependent. MHC-I levels were reduced in VZV-infected cells, and analyses of intracellular MHC-I revealed accumulation of folded MHC-I in the Golgi region, irrespective of ORF66 expression. Thus, the ORF66 kinase is important for VZV-mediated MHC-I downregulation, but additional mechanisms also may be involved. Analyses of the VZV ORF9a protein, the ortholog of the bovine herpesvirus 1 transporter associated with antigen processing inhibitor UL49.5 revealed no effects on MHC-I. These results establish a new role for viral protein kinases in immune evasion and suggest that VZV utilizes unique mechanisms to inhibit antigen presentation.
Figures
FIG. 1.
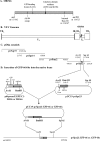
Schematic for creation of VZV containing GFP-66 or GFP-66s in the native ORF66 locus. (A) Representation of the domains of the 393-amino-acid ORF66 protein, showing the positions of key amino acid residues and a BamHI restriction site, as detailed in the text. (B) Relative position of the ORF66 gene in the structure of the VZV genome. Shown are the unique long (UL) and unique short (US) regions as well as the terminal (TRL and TRS) and internal (IRL and IRS) repeats. (C) Relative positions of the four pOka cosmids used to construct recombinant VZV. Genome coordinates are given with respect to the VZV pOka sequence. (D) Strategy for derivation of recombinant VZV expressing the ORF66 gene as an EGFP-tagged fusion protein. The ORF66 promoter and ORF are fully contained within a unique AvrII-SgrAI fragment of pvSpe23, and this fragment was subcloned into a modified pUC19 vector. The ORF66 promoter-GFP-66 cassette was inserted into this subfragment by using AvrII-BamHI, and then the AvrII-SgrAI subfragment was recloned into pvSpe23 as described in Materials and Methods.
FIG. 2.
Live cell imaging to show that GFP-tagged ORF66 retains the ability to exclude IE62 from the nucleus. (A) Single panels showing cellular distributions of individually transfected GFP-66 (i), GFP-66kd (ii), and IE62-dsRed (iii). (B and C) Images of cells coexpressing IE62-dsRed2 and either GFP-66 (B) or GFP66kd (C). Panel i shows autofluorescence of GFP-66 and GFP-66kd, while panel ii shows IE62-dsRed2 autofluorescence from the same cell. All transfections were performed in MeWo cells, and autofluorescence was visualized and captured at 24 h posttransfection by confocal microscopy. Cells were transfected with expression plasmids at a 1:1 ratio.
FIG. 3.
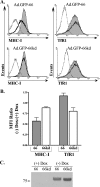
GFP-66 induces a kinase-dependent and specific downregulation of surface MHC-I. (A) MRC-5 cells were infected with Ad.GFP-66 or Ad.GFP-66kd in conjunction with Ad.Tet-Off, grown in the presence or absence of 2 μg/ml of DOX, and harvested at 36 h postinfection. Cells were stained with fluorophore-conjugated antibodies to MHC-I and TfR1 or isotype controls and analyzed using a Becton Dickinson FACSAria. Histograms of surface fluorescence for MHC-I and TfR1 are shown with the infection condition indicated above each. The shaded gray histograms represent infected cells that were incubated with 2 μg/ml DOX. Cells incubated in the absence of DOX were gated on GFP positivity and are represented by the solid black line histograms. The isotype control antibody levels are shown by dotted lines. (B) Graph depicting the average (± standard error of the mean) MFI ratios of MHC-I and TfR1 surface fluorescence from three independent and identical experiments. (C) Immunoblot analysis of an equal number of cells from the Ad.GFP-66 and Ad.GFP-66kd infections under the four experimental conditions. Blots were probed with antibodies to the HA epitope; the proteins reacting in the size range expected are shown.
FIG. 4.
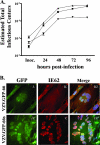
Characterization of recombinant VZV expressing GFP-66 and GFP-66s. (A) Growth curve analyses of VZV.GFP-66 (▴), VZV.GFP-66s (▾), and pOka (▪). Parallel infections were established on confluent monolayers in MRC-5 fibroblasts, and the amount of virus-infected cells in each culture produced by each VZV was titrated on MeWo cells after 24, 48, 72, and 96 hpi. Mean titers and standard errors were deduced from duplicate wells of duplicate titrations. (B) Images showing GFP expression and IE62 cellular localization in fixed VZV.GFP-66-infected (i to iii) and VZV.GFP-66s-infected (iv to vi) MRC-5 cells at 48 hpi. Cells were fixed with 4% paraformaldehyde and stained with rabbit anti-62 and Alexa Fluor 546-conjugated anti-rabbit Fab fragments and Hoechst dye to identify nuclei. The depicted autofluorescence or stained protein is indicated above the panels, and the infection condition is on the left. Images were selected to represent the center of VZV syncytia at approximately the same stage of infection.
FIG. 5.
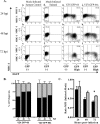
MHC-I downregulation in VZV infection with and without expression of functional kinase. MRC-5 cells were infected with VZV.GFP-66 or VZV.GFP-66s at a ratio of 10:1, surface stained for MHC-I and TfR1 at 24, 48, and 72 hpi, and analyzed by flow cytometry. (A) Dot plots from a representative experiment depicting MHC-I surface expression as a function of GFP-66 or GFP-66s expression. The analysis time point is shown to the left of each row, and the infection condition is shown above each column. Quadrant gates to identify MHC-I-negative and MHC-I-positive cell populations were established at each time point using mock-infected isotype control-stained cells (a to c). The same quadrant gate was used for mock (d to f), VZV.GFP-66 (g to i), and VZV.GFP-66s (j to l) infections. To quantitatively assess differences between VZV.GFP-66 and VZV.GFP-66s infections, cells were gated on high GFP fluorescence, represented as the right-most vertical line in infected cell dot plots (g to l). The GFP-negative and GFP-high (where relevant) cell populations for each column are indicated below panels c, f, i, and l. The percentages of mock-infected cells exhibiting an MHC-I-negative or MHC-I-positive phenotype are indicated in the upper left and lower left quadrants in panels d to f. Similar MHC-I-negative and MHC-I-positive cell percentages in GFP-high cells are indicated in the upper right and lower right quadrants of panels g to l. (B) The average percentage (± standard error of the mean) of MHC-I-positive (gray) and MHC-I-negative (black) cells in the GFP-high gate under each infection condition was calculated from three independent experiments. (C) MFIs of GFP-high cells in VZV.GFP-66 (black) and VZV.GFP-66s (gray) infections were expressed as a ratio of the MFI of mock-infected cells. Average ratios (± standard error of the mean) from three independent experiments were compared at each time point, and we found that VZV.GFP-66 exhibited a significant reduction in MHC-I surface expression over VZV.GFP-66s at 72 hpi. (D and E) TfR1 surface expression dot plots (D) and MFI ratios (E) are shown exactly as described for MHC-I. (F) Lysates of aliquots of equal numbers of cells from each infection condition at each time point were separated by SDS-PAGE and analyzed by immunoblotting sequentially with mouse anti-HA and then mouse anti-α-tubulin antibodies. *, P ≤ 0.05; **, P ≤ 0.005.
FIG. 6.
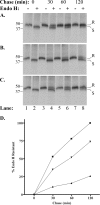
GFP-66 expression induces a delay in MHC-I maturation in MRC-5 fibroblasts. (A) Mock-infected, (B) Ad.GFP-66-infected, or (C) Ad.GFP-66kd-infected cells were pulse-labeled with [35S]Cys/Met and chased in medium containing cold Cys/Met, and folded MHC-I was immunoprecipitated and subjected to endo H digestion. Autoradiographs of proteins separated by SDS-PAGE are shown. The chase time and presence (+) or absence (−) of endo H are indicated above each lane, and lane numbers are shown at the bottom. Class I molecules that are resistant to endo H cleavage migrate more slowly through the gel and are designated by the letter R to the side of each radiograph. Sensitive molecules migrate more quickly and are indicated by the letter S. Protein size standards were run with each gel and are shown (in kDa) to the left. (D) The rate of acquisition of endo H resistance was quantified for mock infections (▪), Ad.GFP-66 infections (▴), and Ad.GFP-66kd infections (▾) using autoradiography. The percentage of the total MHC-I molecules exhibiting resistance was plotted as a function of time.
FIG. 7.
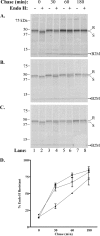
GFP-66 mediates a delay in MHC-I maturation in the context of VZV infection. Endo H resistance analysis was performed for MHC-I molecules from (A) mock-infected, (B) VZV.GFP-66-infected, and (C) VZV.GFP-66s-infected cells. Chase times and treatment with endo H are shown above each radiograph, and lane numbers are shown below. Protein size markers are specified in kDa to the left, and endo H-resistant (R) or -sensitive (S) forms are indicated to the right. (D) The rate of MHC-I maturation was determined by phosphorimager analysis from two independent but identical experiments and is plotted as a function of time for mock infections (▪), VZV.GFP-66 infections (▴), and VZV.GFP-66s infections (▾).
FIG. 8.
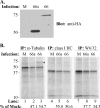
VZV infection reduces class I synthesis and impairs the association of class I heavy chains with β2-M. Total α-tubulin and class I heavy chain levels, as well as folded class I heavy chain levels, were compared by parallel immunoprecipitation from either mock-infected cells (M) or cells infected with VZV.GFP-66 (66) or VZV.GFP-66s (66s), following a 6-hour [35S]Cys/Met label. (A) Immunoblot analysis of cleared infected cell lysates showing the level of GFP-66 and GFP-66s protein expressed under each infection condition. The infection condition is indicated at the top. (B) Autoradiographs of each set of parallel immunoprecipitations. The antibody used and infection condition are indicated above the radiograph, and lane numbers are shown below. Protein size markers (in kDa) are shown to the left. The relative amounts (percentage) of proteins expressed in infected cells compared to uninfected cells for both VZV.GFP-66 and VZV.GFP-66s are shown under lane numbers 2, 3, 5, 6, 8, and 9. The * indicates a reproducible coprecipitating band of ∼75 kDa which was apparent in the α-tubulin immunoprecipitation of VZV.GFP-66-infected cells. This band did not react with antibodies to HA; its identity is currently unknown.
FIG. 9.
MHC-I localization in VZV infection with and without ORF66 expression. Cells on coverslips were either surface stained for MHC-I or stripped of surface β2-M, permeabilized, and stained for intracellular folded MHC-I (W6/32) and rabbit anti-Mann II combined with anti-mouse Alexa-Fluor 647 and anti-rabbit Alexa-Fluor 546, respectively. All cells were stained with Hoechst 33258 to identify nuclei. Z-stacks were acquired and deconvolved for each fluorescent channel. MHC-I, Mann II, and Hoechst stains were pseudo-colored to promote simultaneous observance of each channel in the merged images. (A) MHC-I expression profile in uninfected MRC-5 fibroblasts. MHC-I surface fluorescence is shown as an image merged with Hoechst staining (i). A similar staining pattern was not observed in β2-M-stripped cells, which exhibited low levels of perinuclear MHC-I that partially overlapped with mannosidase II staining (ii to iv). Individual stains are indicated above each micrograph panel. (B) Comparison of intracellular MHC-I distribution in late-stage VZV.GFP-66-infected (i to iv) and VZV.GFP-66s-infected (v to viii) syncytia. Each set of panels shows a representative syncytium. Stains are indicated above each micrograph. In both A and B, arrows highlight specific features that are discussed in the text.
FIG. 10.
The VZV ortholog to BHV-1 UL49.5, ORF9a, does not mediate downregulation of MHC-I surface expression. HEK 293T cells were cotransfected with an EGFP-expressing marker plasmid (pTK-EGFP) and plasmids expressing untagged versions of ORF9a, ORF50, or ORF9a and ORF50 in combination. Empty vector cotransfection was used as a negative control, and cotransfections with plasmids encoding the KSHV K3 MHC-I downregulator (29) or VZV ORF66 served as the positive controls. At 48 h posttransfection, cells were stained for MHC-I and analyzed by flow cytometry. The average MFIs (± standard error of the mean) of GFP-positive cells from four independent experiments are shown. MFI data from each test transfection condition were compared against those of the negative control using a paired Student's t test, and the results are indicated above the corresponding bars. An equal level of pTK-EGFP was maintained under all transfection conditions. NS, not significant.
Similar articles
- Varicella-zoster virus retains major histocompatibility complex class I proteins in the Golgi compartment of infected cells.
Abendroth A, Lin I, Slobedman B, Ploegh H, Arvin AM. Abendroth A, et al. J Virol. 2001 May;75(10):4878-88. doi: 10.1128/JVI.75.10.4878-4888.2001. J Virol. 2001. PMID: 11312359 Free PMC article. - Virion association of IE62, the varicella-zoster virus (VZV) major transcriptional regulatory protein, requires expression of the VZV open reading frame 66 protein kinase.
Kinchington PR, Fite K, Seman A, Turse SE. Kinchington PR, et al. J Virol. 2001 Oct;75(19):9106-13. doi: 10.1128/JVI.75.19.9106-9113.2001. J Virol. 2001. PMID: 11533174 Free PMC article. - Phosphorylation of the varicella-zoster virus (VZV) major transcriptional regulatory protein IE62 by the VZV open reading frame 66 protein kinase.
Eisfeld AJ, Turse SE, Jackson SA, Lerner EC, Kinchington PR. Eisfeld AJ, et al. J Virol. 2006 Feb;80(4):1710-23. doi: 10.1128/JVI.80.4.1710-1723.2006. J Virol. 2006. PMID: 16439528 Free PMC article. - Immune evasion mechanisms of varicella-zoster virus.
Abendroth A, Arvin A. Abendroth A, et al. Arch Virol Suppl. 2001;(17):99-107. doi: 10.1007/978-3-7091-6259-0_11. Arch Virol Suppl. 2001. PMID: 11339556 Review. - Varicella-zoster virus immune evasion.
Abendroth A, Arvin A. Abendroth A, et al. Immunol Rev. 1999 Apr;168:143-56. doi: 10.1111/j.1600-065x.1999.tb01289.x. Immunol Rev. 1999. PMID: 10399071 Review.
Cited by
- An in vitro model of latency and reactivation of varicella zoster virus in human stem cell-derived neurons.
Markus A, Lebenthal-Loinger I, Yang IH, Kinchington PR, Goldstein RS. Markus A, et al. PLoS Pathog. 2015 Jun 4;11(6):e1004885. doi: 10.1371/journal.ppat.1004885. eCollection 2015 Jun. PLoS Pathog. 2015. PMID: 26042814 Free PMC article. - Simian varicella virus pathogenesis.
Mahalingam R, Messaoudi I, Gilden D. Mahalingam R, et al. Curr Top Microbiol Immunol. 2010;342:309-21. doi: 10.1007/82_2009_6. Curr Top Microbiol Immunol. 2010. PMID: 20186611 Free PMC article. - Histone deacetylases 1 and 2 are phosphorylated at novel sites during varicella-zoster virus infection.
Walters MS, Erazo A, Kinchington PR, Silverstein S. Walters MS, et al. J Virol. 2009 Nov;83(22):11502-13. doi: 10.1128/JVI.01318-09. Epub 2009 Sep 9. J Virol. 2009. PMID: 19740981 Free PMC article. - Varicella-zoster virus (VZV) infection of neurons derived from human embryonic stem cells: direct demonstration of axonal infection, transport of VZV, and productive neuronal infection.
Markus A, Grigoryan S, Sloutskin A, Yee MB, Zhu H, Yang IH, Thakor NV, Sarid R, Kinchington PR, Goldstein RS. Markus A, et al. J Virol. 2011 Jul;85(13):6220-33. doi: 10.1128/JVI.02396-10. Epub 2011 Apr 27. J Virol. 2011. PMID: 21525353 Free PMC article. - Varicella-Zoster Virus and Herpes Simplex Virus 1 Differentially Modulate NKG2D Ligand Expression during Productive Infection.
Campbell TM, McSharry BP, Steain M, Slobedman B, Abendroth A. Campbell TM, et al. J Virol. 2015 Aug;89(15):7932-43. doi: 10.1128/JVI.00292-15. Epub 2015 May 20. J Virol. 2015. PMID: 25995251 Free PMC article.
References
- Arbeit, R. D., J. A. Zaia, M. A. Valerio, and M. J. Levin. 1982. Infection of human peripheral blood mononuclear cells by varicella-zoster virus. Intervirology 18:56-65. - PubMed
- Arvin, A. M., M. Sharp, M. Moir, P. R. Kinchington, M. Sadeghi-Zadeh, W. T. Ruyechan, and J. Hay. 2002. Memory cytotoxic T cell responses to viral tegument and regulatory proteins encoded by open reading frames 4, 10, 29, and 62 of varicella-zoster virus. Viral Immunol. 15:507-516. - PubMed
Publication types
MeSH terms
Substances
Grants and funding
- R01 EY009397/EY/NEI NIH HHS/United States
- EY08098/EY/NEI NIH HHS/United States
- EY09397/EY/NEI NIH HHS/United States
- T32 AI49820/AI/NIAID NIH HHS/United States
- T32 AI049820/AI/NIAID NIH HHS/United States
- P30 EY008098/EY/NEI NIH HHS/United States
LinkOut - more resources
Full Text Sources
Research Materials
