Identification of higher-order functional domains in the human ENCODE regions - PubMed (original) (raw)
Comparative Study
Identification of higher-order functional domains in the human ENCODE regions
Robert E Thurman et al. Genome Res. 2007 Jun.
Abstract
It has long been posited that human and other large genomes are organized into higher-order (i.e., greater than gene-sized) functional domains. We hypothesized that diverse experimental data types generated by The ENCODE Project Consortium could be combined to delineate active and quiescent or repressed functional domains and thereby illuminate the higher-order functional architecture of the genome. To address this, we coupled wavelet analysis with hidden Markov models for unbiased discovery of "domain-level" behavior in high-resolution functional genomic data, including activating and repressive histone modifications, RNA output, and DNA replication timing. We find that higher-order patterns in these data types are largely concordant and may be analyzed collectively in the context of HeLa cells to delineate 53 active and 62 repressed functional domains within the ENCODE regions. Active domains comprise approximately 44% of the ENCODE regions but contain approximately 75%-80% of annotated genes, transcripts, and CpG islands. Repressed domains are enriched in certain classes of repetitive elements and, surprisingly, in evolutionarily conserved nonexonic sequences. The functional domain structure of the ENCODE regions appears to be largely stable across different cell types. Taken together, our results suggest that higher-order functional domains represent a fundamental organizing principle of human genome architecture.
Figures
Figure 1.
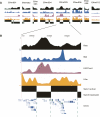
Wavelet segmentation approach for functional domain mapping. (A) Exemplary continuous functional data type (H3 acetylation) for ENCODE region ENm005. (B) Continuous wavelet transform heatmap (“scalogram”) of H3 acetylation data. In the heatmap, the horizontal axis represents genomic position, while the vertical axis represents wavelet scale. Each color in the scalogram represents the magnitude of the wavelet coefficient at that genomic position and scale, ranging from blue (small magnitude) to white (large magnitude). Larger magnitude wavelet coefficients imply a strong trend in the original data at that position and scale. The 64-kb scale is marked with a dashed red line. (C) Wavelet smoothed data at the 64-kb scale obtained using MODWT. Horizontal axis: genomic position. Vertical axis: wavelet coefficient at that position at the 64-kb scale. (D) Results from two HMM state segmentation of data from C, based on fitting HMM to H3ac data over all ENCODE regions. The top row indicates state 1 regions in black, while the bottom row indicates state 0 regions in black. The high state (state 1) is taken to represent active domains based on the assumption that H3ac is an activating mark. (E) GENCODE gene annotations for ENm005. Note the correspondence between state 1/active and GENCODE gene and density.
Figure 2.
Simultaneous segmentation of four ENCODE functional data types. (A) Exemplary results from eight ENCODE regions ENm001 (1.8 Mb), ENm002 (1 Mb), ENm003 (600 kb), ENm004 (1.7 Mb), ENm005 (1.6 Mkb), ENm006 (1 Mb), ENm008 (1 Mb), and ENm012 (1.2 Mb). For each ENCODE region subpanel, wavelet smoothed data are displayed as tracks ordered _top_-to-bottom as follows: TR50 (black), RNA (blue), H3K27me3 (purple), and H3ac (orange). State assignments (domains) resulting from simultaneous HMM segmentation are shown at bottom as black rectangles; see Fig. 1 for additional description. (B) Close-up of ENCODE region ENm005, with bracketed intervals indicating exemplary domains in states 0 and 1. State 1 generally corresponds to higher levels of RNA and H3ac and lower levels of TR50 and H3K27me3, and is therefore assigned the active label, while state 0 is correspondingly assigned repressed. The latter contains the oligodendrocyte-specific OLIG1 and OLIG2 genes, which are repressed in the tissues studied under ENCODE.
Figure 3.
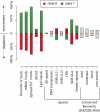
Enrichment and depletion of annotated genomic features in active and repressed domains. Data are based on simultaneous segmentation of four data types (H3ac, H3K27me3, RNA, TR50). Green bars correspond to active state regions, red bars to repressed regions. Values (Y axis) indicate percentage enrichment or depletion over random expectation. For example, GENCODE TxStarts are ∼71% enriched over expectation in active regions and ∼61% depleted under expectation in repressed regions (see Table 4 for corresponding data). Shaded bars reflect enrichment or depletion that is not significant at the 0.01 level based on the label permutation test (see Methods).
Similar articles
- Pan-S replication patterns and chromosomal domains defined by genome-tiling arrays of ENCODE genomic areas.
Karnani N, Taylor C, Malhotra A, Dutta A. Karnani N, et al. Genome Res. 2007 Jun;17(6):865-76. doi: 10.1101/gr.5427007. Genome Res. 2007. PMID: 17568004 Free PMC article. - The landscape of histone modifications across 1% of the human genome in five human cell lines.
Koch CM, Andrews RM, Flicek P, Dillon SC, Karaöz U, Clelland GK, Wilcox S, Beare DM, Fowler JC, Couttet P, James KD, Lefebvre GC, Bruce AW, Dovey OM, Ellis PD, Dhami P, Langford CF, Weng Z, Birney E, Carter NP, Vetrie D, Dunham I. Koch CM, et al. Genome Res. 2007 Jun;17(6):691-707. doi: 10.1101/gr.5704207. Genome Res. 2007. PMID: 17567990 Free PMC article. - ChromaSig: a probabilistic approach to finding common chromatin signatures in the human genome.
Hon G, Ren B, Wang W. Hon G, et al. PLoS Comput Biol. 2008 Oct;4(10):e1000201. doi: 10.1371/journal.pcbi.1000201. Epub 2008 Oct 17. PLoS Comput Biol. 2008. PMID: 18927605 Free PMC article. - Epigenetics, chromatin and genome organization: recent advances from the ENCODE project.
Siggens L, Ekwall K. Siggens L, et al. J Intern Med. 2014 Sep;276(3):201-14. doi: 10.1111/joim.12231. Epub 2014 Mar 27. J Intern Med. 2014. PMID: 24605849 Review. - Molecular coupling of DNA methylation and histone methylation.
Hashimoto H, Vertino PM, Cheng X. Hashimoto H, et al. Epigenomics. 2010 Oct;2(5):657-69. doi: 10.2217/epi.10.44. Epigenomics. 2010. PMID: 21339843 Free PMC article. Review.
Cited by
- CHANGE POINT ANALYSIS OF HISTONE MODIFICATIONS REVEALS EPIGENETIC BLOCKS LINKING TO PHYSICAL DOMAINS.
Chen M, Lin H, Zhao H. Chen M, et al. Ann Appl Stat. 2016 Mar;10(1):506-526. doi: 10.1214/16-AOAS905. Epub 2016 Mar 25. Ann Appl Stat. 2016. PMID: 27231496 Free PMC article. - Precision and efficacy of RNA-guided DNA integration in high-expressing muscle loci.
Padmaswari MH, Bulliard G, Agrawal S, Jia MS, Khadgi S, Murach KA, Nelson CE. Padmaswari MH, et al. Mol Ther Nucleic Acids. 2024 Sep 2;35(4):102320. doi: 10.1016/j.omtn.2024.102320. eCollection 2024 Dec 10. Mol Ther Nucleic Acids. 2024. PMID: 39398225 Free PMC article. - Interplay between chromatin state, regulator binding, and regulatory motifs in six human cell types.
Ernst J, Kellis M. Ernst J, et al. Genome Res. 2013 Jul;23(7):1142-54. doi: 10.1101/gr.144840.112. Epub 2013 Apr 17. Genome Res. 2013. PMID: 23595227 Free PMC article. - A unified encyclopedia of human functional DNA elements through fully automated annotation of 164 human cell types.
Libbrecht MW, Rodriguez OL, Weng Z, Bilmes JA, Hoffman MM, Noble WS. Libbrecht MW, et al. Genome Biol. 2019 Aug 28;20(1):180. doi: 10.1186/s13059-019-1784-2. Genome Biol. 2019. PMID: 31462275 Free PMC article. - Simultaneous characterization of sense and antisense genomic processes by the double-stranded hidden Markov model.
Glas J, Dümcke S, Zacher B, Poron D, Gagneur J, Tresch A. Glas J, et al. Nucleic Acids Res. 2016 Mar 18;44(5):e44. doi: 10.1093/nar/gkv1184. Epub 2015 Nov 17. Nucleic Acids Res. 2016. PMID: 26578558 Free PMC article.
References
- Allen T.E., Herrgrd M.J., Liu M., Qiu Y., Glasner J.D., Blattner F.R., Palsson B.O., Herrgrd M.J., Liu M., Qiu Y., Glasner J.D., Blattner F.R., Palsson B.O., Liu M., Qiu Y., Glasner J.D., Blattner F.R., Palsson B.O., Qiu Y., Glasner J.D., Blattner F.R., Palsson B.O., Glasner J.D., Blattner F.R., Palsson B.O., Blattner F.R., Palsson B.O., Palsson B.O. Genome-scale analysis of the uses of the Escherichia coli genome: Model-driven analysis of heterogeneous data sets. J. Bacteriol. 2003;185:6392–6399. - PMC - PubMed
- Ashburner M., Ball C.A., Blake J.A., Botstein D., Butler H., Cherry J.M., Davis A.P., Dolinski K., Dwight S.S., Eppig J.T., Ball C.A., Blake J.A., Botstein D., Butler H., Cherry J.M., Davis A.P., Dolinski K., Dwight S.S., Eppig J.T., Blake J.A., Botstein D., Butler H., Cherry J.M., Davis A.P., Dolinski K., Dwight S.S., Eppig J.T., Botstein D., Butler H., Cherry J.M., Davis A.P., Dolinski K., Dwight S.S., Eppig J.T., Butler H., Cherry J.M., Davis A.P., Dolinski K., Dwight S.S., Eppig J.T., Cherry J.M., Davis A.P., Dolinski K., Dwight S.S., Eppig J.T., Davis A.P., Dolinski K., Dwight S.S., Eppig J.T., Dolinski K., Dwight S.S., Eppig J.T., Dwight S.S., Eppig J.T., Eppig J.T., et al. Gene ontology: Tool for the unification of biology. The Gene Ontology Consortium. Nat. Genet. 2000;25:25–29. - PMC - PubMed
- Azuara V Perry P., Sauer S., Spivakov M., Jorgensen H.F., John R.M., Gouti M., Casanova M., Warnes G., Merkenschlager M., Sauer S., Spivakov M., Jorgensen H.F., John R.M., Gouti M., Casanova M., Warnes G., Merkenschlager M., Spivakov M., Jorgensen H.F., John R.M., Gouti M., Casanova M., Warnes G., Merkenschlager M., Jorgensen H.F., John R.M., Gouti M., Casanova M., Warnes G., Merkenschlager M., John R.M., Gouti M., Casanova M., Warnes G., Merkenschlager M., Gouti M., Casanova M., Warnes G., Merkenschlager M., Casanova M., Warnes G., Merkenschlager M., Warnes G., Merkenschlager M., Merkenschlager M., et al. Chromatin signatures of pluripotent cell lines. Nat. Cell Biol. 2006;8:532–538. - PubMed
Publication types
MeSH terms
Substances
LinkOut - more resources
Full Text Sources
Other Literature Sources
Research Materials


