Changes in apparent free energy of helix-helix dimerization in a biological membrane due to point mutations - PubMed (original) (raw)
Changes in apparent free energy of helix-helix dimerization in a biological membrane due to point mutations
Mylinh T Duong et al. J Mol Biol. 2007.
Abstract
We present an implementation of the TOXCAT membrane protein self-association assay that measures the change in apparent free energy of transmembrane helix dimerization caused by point mutations. Quantifying the reporter gene expression from cells carrying wild-type and mutant constructs shows that single point mutations that disrupt dimerization of the transmembrane domain of glycophorin A reproducibly lower the TOXCAT signal more than 100-fold. Replicate cultures can show up to threefold changes in the level of expression of the membrane bound fusion construct, and correcting for these variations improves the precision of the calculated apparent free energy change. The remarkably good agreement between our TOXCAT apparent free energy scale and free energy differences from sedimentation equilibrium studies for point mutants of the glycophorin A transmembrane domain dimer indicate that sequence changes usually affect membrane helix-helix interactions quite similarly in these two very different environments. However, the effects of point mutations at threonine 87 suggest that intermonomer polar contacts by this side-chain contribute significantly to dimer stability in membranes but not in detergents. Our findings demonstrate that a comparison of quantitative measurements of helix-helix interactions in biological membranes and genuine thermodynamic data from biophysical measurements on purified proteins can elucidate how changes in the lipidic environment modulate membrane protein stability.
Figures
Figure 1. Schematic representation of the TOXCAT assay
ToxR′ domains (diamonds) can activate transcription of the reporter gene (CAT) if brought together by the transmembrane domains. The maltose binding protein domain (circles) helps direct the insertion of the construct into the membrane, complements the malE mutation in the host cells, and serves as an epitope for quantifying the level of fusion protein.
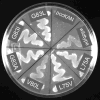
Figure 2. Complementation assays for wild type and selected mutant glycophorin A ToxR′ fusion constructs
NT326 cells (malE) carrying various constructs were streaked on a plate with maltose as the sole carbon source and grown for three daysat 37 °C. All ToxR′(GpATMD)MBP fusion constructs permit robust growth of NT326 cells on maltose, while control transformants (pccKAN) do not.
Figure 3. Reporter gene activity and fusion construct expression data for one replicate of mutant and wild type glycophorin A constructs
Yellow bars represent the CAT activity quantified from cleared lysates, and error bars represent the standard error for three measurements of each lysate. Bands below the bars are details from western blots of the ToxR fusions; the intensities of these bands were quantified by photon counting of chemiluminescence. The differences in the observed CAT activity are much larger than the differences in ToxR fusion expression level.
Figure 4. Histogram of the variation in ToxR′(GpATMD)MBP fusion expression compared to wild type
The top scale gives the ratio of wild type to mutant western blot band intensity; the bottom scale converts this ratio to the term used to correct the apparent free energy. Each of the 84 mutant cultures is represented in this figure, scaled to the wild type culture with which it was grown on that particular day. The level of expression of the fusion construct can affect the apparent free energy by as much as 1 kcal mol−1 in either direction.
Figure 5. Correlation of TOXCAT apparent free energy changes with free energy differences determined by sedimentation equilibrium analytical ultracentrifugation ; –;
Mutations involving Thr87 are represented as black dots and are labeled in bold; omitting these data points from the fit gives R = 0.80. The near-unity slope of this fit shows that the TOXCAT assay samples the same range as the biophysical measurements.
Figure 6. Simulations suggest that the effects of mutations on measured CAT levels are consistent with low fractional dimerization of the wild type fusion protein
The solid curves depict how CAT activity (y-axis) would drop off as the dimer is destabilized up to 4 kcal mol−1 (x-axis) when the wild type construct is assumed to be present at the indicated mole fractions of monomer; the two unlabeled lines farthest to the left are for wild type monomer mole fractions of 0.01 and 0.001. CAT activity (yellow bars) for wild type glycophorin A and 18 mutants are presented at horizontal positions corresponding to the free energy change for each variant as measured by sedimentation equilibrium ; –; . Outliers from the _t_-test comparison have been excluded. CAT activities are shown are for individual replicates with very similar fusion protein expression levels, eliminating the need to correct for concentration effects. The yellow bar labeled with an asterisk corresponds to Thr87Ser, which is mildly disruptive by sedimentation equilibrium but dimerizes as wildtype in TOXCAT.
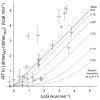
Figure 7. Predicted deviation of ΔΔ_G_app from ΔΔ G for varying absolute association of wild type fusion construct
For wild type species with the fraction monomeric protein indicated at right, we calculate monomer and dimer fractions exactly for a range of −G (using K_a from equation 3) and then calculate ΔΔ_G_app using the first term of equation 10 (−RT ln [dimerWT/dimermut]), which assumes that the mole fraction of monomeric protein can be approximated as the total protein. In the dilute limit (solid line, slope = 1) the assumption holds, but as the fraction of monomeric protein decreases, ΔΔ_G_app initially changes more slowly than ΔΔ_G (dashed lines). The (ΔΔ_G_mut, ΔΔ_G_app) data points from Figure 5 except mutants at Thr87 have been superimposed along with the linear regression for these points (dotted line, slope = 1.08).
Figure 8. Regression analysis of apparent free energies from TOXCAT versus the SDS-PAGE phenotypes of Lemmon et al.
The poor fit achieved using the arbitrary scale of the SDS-PAGE phenotypes (Panel A) can be significantly improved by adding a term that accounts for the change in hydrophobicity of each substitution (Panel B). Mutations at Thr87 are presented as black dots.
Similar articles
- The effect of point mutations on the free energy of transmembrane alpha-helix dimerization.
Fleming KG, Ackerman AL, Engelman DM. Fleming KG, et al. J Mol Biol. 1997 Sep 19;272(2):266-75. doi: 10.1006/jmbi.1997.1236. J Mol Biol. 1997. PMID: 9299353 - Specificity in transmembrane helix-helix interactions can define a hierarchy of stability for sequence variants.
Fleming KG, Engelman DM. Fleming KG, et al. Proc Natl Acad Sci U S A. 2001 Dec 4;98(25):14340-4. doi: 10.1073/pnas.251367498. Epub 2001 Nov 27. Proc Natl Acad Sci U S A. 2001. PMID: 11724930 Free PMC article. - TOXCAT: a measure of transmembrane helix association in a biological membrane.
Russ WP, Engelman DM. Russ WP, et al. Proc Natl Acad Sci U S A. 1999 Feb 2;96(3):863-8. doi: 10.1073/pnas.96.3.863. Proc Natl Acad Sci U S A. 1999. PMID: 9927659 Free PMC article. - How do helix-helix interactions help determine the folds of membrane proteins? Perspectives from the study of homo-oligomeric helical bundles.
DeGrado WF, Gratkowski H, Lear JD. DeGrado WF, et al. Protein Sci. 2003 Apr;12(4):647-65. doi: 10.1110/ps.0236503. Protein Sci. 2003. PMID: 12649422 Free PMC article. Review. - Investigations of membrane protein interactions in cells using fluorescence microscopy.
Abouelkheir M, Roy T, Krzyscik MA, Özdemir E, Hristova K. Abouelkheir M, et al. Curr Opin Struct Biol. 2024 Jun;86:102816. doi: 10.1016/j.sbi.2024.102816. Epub 2024 Apr 21. Curr Opin Struct Biol. 2024. PMID: 38648680 Free PMC article. Review.
Cited by
- Identifying key juxtamembrane interactions in cell membranes using AraC-based transcriptional reporter assay (AraTM).
Su PC, Berger BW. Su PC, et al. J Biol Chem. 2012 Sep 7;287(37):31515-26. doi: 10.1074/jbc.M112.396895. Epub 2012 Jul 22. J Biol Chem. 2012. PMID: 22822084 Free PMC article. - Transmembrane domains of the syndecan family of growth factor coreceptors display a hierarchy of homotypic and heterotypic interactions.
Dews IC, Mackenzie KR. Dews IC, et al. Proc Natl Acad Sci U S A. 2007 Dec 26;104(52):20782-7. doi: 10.1073/pnas.0708909105. Epub 2007 Dec 19. Proc Natl Acad Sci U S A. 2007. PMID: 18093920 Free PMC article. - Hill coefficient analysis of transmembrane helix dimerization.
Soong R, Merzlyakov M, Hristova K. Soong R, et al. J Membr Biol. 2009 Jul;230(1):49-55. doi: 10.1007/s00232-009-9185-1. Epub 2009 Jul 15. J Membr Biol. 2009. PMID: 19603128 Free PMC article. - Multi-Tox: application of the ToxR-transcriptional reporter assay to the study of multi-pass protein transmembrane domain oligomerization.
Joce C, Wiener AA, Yin H. Joce C, et al. Biochim Biophys Acta. 2011 Dec;1808(12):2948-53. doi: 10.1016/j.bbamem.2011.07.008. Epub 2011 Jul 23. Biochim Biophys Acta. 2011. PMID: 21791200 Free PMC article. - Protein Design: From the Aspect of Water Solubility and Stability.
Qing R, Hao S, Smorodina E, Jin D, Zalevsky A, Zhang S. Qing R, et al. Chem Rev. 2022 Sep 28;122(18):14085-14179. doi: 10.1021/acs.chemrev.1c00757. Epub 2022 Aug 3. Chem Rev. 2022. PMID: 35921495 Free PMC article. Review.
References
- MacKenzie KR. Folding and Stability of alpha-Helical Integral Membrane Proteins. Chem Rev. 2006;106:1931–77. - PubMed
- Fleming KG, Ackerman AL, Engelman DM. The effect of point mutations on the free energy of transmembrane alpha-helix dimerization. J Mol Biol. 1997;272:266–75. - PubMed
- Fleming KG. Probing stability of helical transmembrane proteins. Methods Enzymol. 2000;323:63–77. - PubMed
- Fleming KG. Standardizing the free energy change of transmembrane helix-helix interactions. J Mol Biol. 2002;323:563–71. - PubMed
Publication types
MeSH terms
Substances
LinkOut - more resources
Full Text Sources


