MGluR-mediated calcium waves that invade the soma regulate firing in layer V medial prefrontal cortical pyramidal neurons - PubMed (original) (raw)
MGluR-mediated calcium waves that invade the soma regulate firing in layer V medial prefrontal cortical pyramidal neurons
Anna M Hagenston et al. Cereb Cortex. 2008 Feb.
Abstract
Factors that influence the activity of prefrontal cortex (PFC) pyramidal neurons are likely to play an important role in working memory function. One such factor may be the release of Ca2+ from intracellular stores. Here we investigate the hypothesis that metabotropic glutamate receptors (mGluRs)-mediated waves of internally released Ca2+ can regulate the intrinsic excitability and firing patterns of PFC pyramidal neurons. Synaptic or focal pharmacological activation of mGluRs triggered Ca2+ waves in the dendrites and somata of layer V medial PFC pyramidal neurons. These Ca2+ waves often evoked a transient SK-mediated hyperpolarization followed by a prolonged depolarization that respectively decreased and increased neuronal excitability. Generation of the hyperpolarization depended on whether the Ca2+ wave invaded or came near to the soma. The depolarization also depended on the extent of Ca2+ wave propagation. We tested factors that influence the propagation of Ca2+ waves into the soma. Stimulating more synapses, increasing inositol trisphosphate concentration near the soma, and priming with physiological trains of action potentials all enhanced the amplitude and likelihood of evoking somatic Ca2+ waves. These results suggest that mGluR-mediated Ca2+ waves may regulate firing patterns of PFC pyramidal neurons engaged by working memory, particularly under conditions that favor the propagation of Ca2+ waves into the soma.
Conflict of interest statement
Conflict of Interest: None declared.
Figures
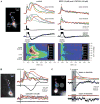
Figure 1
Multiple methods for eliciting propagating Ca2+ waves in mPFC layer V pyramidal neurons. (A) Synaptically evoked internal Ca2+ release. Left, Alexa fluorescence image of a bis-fura-2–filled rat neuron (the patch pipette tip is visible on the soma). Colored boxes indicate regions of interest (ROIs) corresponding to the optical traces on right. The dashed yellow line identifies the position of the pseudo-linescan. Right, optical and electrical traces and pseudo-linescans show fluorescence changes and electrical responses to synaptic stimulation (50 pulses at 100 Hz) under control conditions and following bath application of the group I mGluR antagonists MPEP (10 μM) and LY367385 (100 μM). Stimulation under control conditions triggered EPSPs and 5 action potentials. These were followed by a brief membrane hyperpolarization and a prolonged membrane depolarization. [Ca2+]i rises associated with action potentials, which are marked by asterisks, occurred almost simultaneously in all regions of the soma and dendrites. Ca2+ waves initiated after a delay in both the primary apical dendrite (near the blue and green regions) and in a basal dendrite (near the lime-colored region) and propagated into the soma. Stimulation following bath application of mGluR antagonists triggered 5 action potentials and associated rises in [Ca2+]i, but it neither triggered Ca2+ waves nor gave rise to a hyperpolarization or depolarization. The recording ACSF contained DL-APV (50 μM), gabazine (10 μM), and CGP55845 (1 μM) to block NMDA, GABAA, and GABAB receptors, respectively, throughout this experiment. (B) Pharmacologically elicited internal Ca2+ release. Left, Alexa fluorescence image of a bis-fura-2–filled rat neuron with differential interference contrast overlay showing the position of the pressure application pipette adjacent to the primary apical dendrite. Right, ACPD puffs (80 ms) triggered bidirectionally propagating Ca2+ waves that invaded the soma and were accompanied by a hyperpolarization and a depolarization. Puff-evoked rises in [Ca2+]i, the hyperpolarization, and the depolarization were all absent after bath application of ryanodine (15 μM) to deplete internal stores. (C) Internal Ca2+ release triggered by focal photolysis of NPE-caged IP3. Left, Alexa fluorescence image of a rat neuron filled with fluo-4 and 97 μM NPE-caged IP3. The pale yellow circles show the approximate size (~20 μm diameter) and positions of the UV uncaging beam. Right, brief UV flashes (500 ms) triggered bidirectionally propagating Ca2+ waves and a transient hyperpolarization when the uncaging beam was directed at the primary apical dendrite. Neither a release nor a hyperpolarization was observed when the beam was directed at an adjacent region of the slice approximately 27 μm away from the cell. The top set of traces represents an average of 2 trials. The bottom set of traces represents data from a single trial. Optical data shown in this figure were corrected for the tissue autofluorescence that arises from exposure to the uncaging beam.
Figure 2
The hyperpolarization was mediated by SK-type Ca2+-activated K+ channels. The depolarization had characteristics consistent with activation of a nonspecific cationic current. (A) ACPD puffs (60 ms) triggered Ca2+ waves (not shown) and a hyperpolarization and depolarization while this rat cell was held in current clamp at different membrane potentials. At depolarized potentials, both the hyperpolarization and the depolarization increased in magnitude. At hyperpolarized potentials, the hyperpolarization and depolarization both became smaller. Only the hyperpolarization reversed. (B) Ca2+ waves and a hyperpolarization were triggered by ACPD puffs onto rat neurons at different membrane potentials. Hyperpolarization magnitude increased with depolarization in all cells tested and reversed (−82.5 ± 1.0 mV) in all cells for which Ca2+ waves were triggered at potentials more negative than −80 mV. (C) Ca2+ waves and a depolarization were triggered by ACPD puffs onto rat neurons at different membrane potentials. Depolarization magnitude increased with depolarization and decreased with hyperpolarization in all cells tested but did not apparently reverse. (D) ACPD puffs (100 ms) onto this ferret neuron triggered Ca2+ waves with standard recording ACSF and following addition of the SK-type Ca2+-activated K+ channel antagonist, apamin (100 nM). In control recording ACSF, puffs of ACPD triggered a brief membrane hyperpolarization followed by a sustained membrane depolarization. Following application of apamin, the depolarization persisted, but the hyperpolarization was no longer detectable. (E) Ca2+ waves and a depolarization were triggered by puffs of ACPD (50–100 ms) onto this rat neuron in normal recording ACSF (100 ms puff) and following addition of the broad-spectrum K+ channel antagonist, TEA (10 mM; 50 ms puff). The depolarization was not inhibited by TEA exposure.
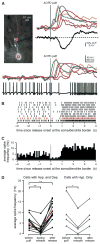
Figure 3
The hyperpolarization and depolarization modulated the firing of mPFC layer V pyramidal neurons. (A) Left, Alexa fluorescence image of a bis-fura-2–filled rat neuron with differential interference contrast overlay showing the position of the pressure application pipette adjacent to the primary apical dendrite. Right, a puff of ACPD (40 ms) evoked a Ca2+ wave, a hyperpolarization, and a depolarization. Bottom, when depolarized with positive somatic current injection (300 pA), the cell fired action potentials at an average rate of 6.2 Hz. A puff of ACPD (30 ms) given during the spike train triggered a Ca2+ wave that was accompanied by a decrease in the mean firing rate to 1.3 Hz. After the dendritic Ca2+ wave had subsided, the mean firing rate increased to 14.0 Hz. (B) Spike rasters depicting trains of action potentials evoked by 250–300 pA current injections and modulated following 30- to 40-ms puffs of ACPD for the cell shown in (A). Spike rasters are aligned with the onset of internal Ca2+ release at the soma–dendrite border. The spike raster for the event depicted in (A) is shown in red. (C) Average spike frequency histogram with 100-ms bins for the 9 events depicted in (B). (D) The average frequency of action potentials evoked by depolarizing current injection prior to APCD application, during Ca2+ release, and after the dendritic Ca2+ wave had subsided for 14 rat cells that exhibited both a hyperpolarization and a depolarization (left) and for 4 ferret cells that exhibited a hyperpolarization but no depolarization (right). Average spike frequency decreased during Ca2+ release in 18/18 cells that exhibited a hyperpolarization, and subsequently increased above the baseline in 14/14 cells that exhibited a depolarization, and in 0/4 cells that did not exhibit a depolarization. Data for the cell depicted in (A_–_C) are shown in red. Statistical significance was determined using paired Student’s _t_-tests; statistically significant changes in firing frequency relative to baseline are indicated with asterisks (**P < 0.001, *P <0.05).
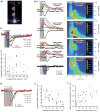
Figure 4
The hyperpolarization depended on somatic and perisomatic [Ca2+]i rises. (A) Cells are divided into 2 groups: those in which Ca2+ waves were observed in both the dendrites and the soma and those in which Ca2+ waves were confined to the dendrites. Plotted are the percentage of cells in each group for which a hyperpolarization was observed or not observed, broken down according to the type of stimulus used to evoke internal Ca2+ release. Cells in which Ca2+ waves invaded the soma were more likely to exhibit a hyperpolarization than cells in which Ca2+ waves were confined to the dendrites. (B) Plotted in ascending order are the magnitudes of the maximum hyperpolarization measured for the 2 groups of cells described in (A). The maximum magnitudes of hyperpolarizations evoked in cells for which Ca2+ waves propagated from the dendrites into the soma were significantly greater than those of hyperpolarizations evoked in cells for which Ca2+ waves were confined to the dendrites alone (P <0.001, KS). (C) Hyperpolarization magnitude versus the maximum amplitude of [Ca2+]i rises in the somata or in the primary apical dendrites for multiple trials in 5 representative cells. Maximum Δ_F_/F amplitudes were calculated for the red (soma) and green (dendritic) regions shown in (D, E). The hyperpolarization magnitude varied with somatic, but not dendritic, [Ca2+]i rises. (D) Top**,** approximate region of interest (ROI) locations over the soma and primary apical dendrite of a schematic cell. Bottom, P values from linear regression analyses comparing hyperpolarization magnitudes with the maximum amplitudes of [Ca2+]i rises in 5–7 ROIs spaced at approximately even intervals in 11 rat and 6 ferret cells. The hyperpolarization magnitude consistently correlated with the maximum Δ_F_/F amplitude for somatic and perisomatic (red, lime, and blue) but not dendritic (green, orange, purple, and brown) ROIs. (E) Approximate ROI locations and R2 values from the same linear regression analyses described in (D).
Figure 5
The depolarization depended on the spatial extent of propagating Ca2+ waves. (A) Cells are divided into 2 groups: those in which Ca2+ waves were observed in both the dendrites and the soma and those in which Ca2+ waves were confined to the dendrites. Plotted are the percentage of cells in each group for which a depolarization was observed or not observed, broken down according to the type of stimulus used to evoke internal Ca2+ release. Cells in which Ca2+ waves invaded the soma were more likely to exhibit a depolarization than cells in which Ca2+ waves were confined to the dendrites. (B) Plotted in ascending order are the magnitudes of the maximum depolarization measured for the 2 groups of cells described in (A). The maximum magnitudes of depolarizations evoked in cells for which Ca2+waves propagated from the dendrites into the soma were generally, but not significantly, greater than those of depolarizations evoked in cells for which Ca2+waves were confined to the dendrites alone (P_>0.05, KS). (C) Depolarization magnitude versus the maximum amplitude of [Ca2+]i rises in the somata or in the primary apical dendrites for multiple trials in 5 representative cells. Maximum Δ_F/F amplitudes were calculated for the red (soma) and green (dendritic) regions shown in (D, E). The depolarization magnitude increased with the maximum amplitude of [Ca2+]i rises. (D) Top**,** approximate region of interest (ROI) locations over the soma and primary apical dendrite of a schematic cell. Bottom, P values from linear regression analyses comparing depolarization magnitudes with the maximum amplitudes of [Ca2+]i rises in 5–7 ROIs spaced at approximately even intervals in 10 rat and 7 ferret cells. The depolarization magnitude correlated more frequently with somatic and perisomatic than with dendritic [Ca2+]i rises. (E) Approximate ROI locations and R2 values from the same analyses described in (D).
Figure 6
Increased stimulus intensity promoted the propagation of Ca2+ waves into the soma. (A) Trains of synaptic stimulation (30 pulses at 100 Hz) triggered Ca2+ waves in the primary apical dendrite and in a basal dendrite of the rat cell shown at right. The weakest stimulation intensity (60 μA) evoked threshold-level [Ca2+]i rises that were confined to the dendrites. When a stronger stimulation was used (80 μA), the Ca2+ waves were exhibited more extensive spread. The 80 μA stimulation intensity evoked 2 action potentials in the trial shown here and one action potential in a second trial. The strongest stimulation intensity (100 μA) triggered Ca2+ waves that invaded and passed through the soma. The 100 μA stimulation intensity also triggered 3 action potentials. For only the strongest stimulation intensity were Ca2+ waves accompanied by a distinct hyperpolarization. (B) Maximum Δ_F_/F is plotted versus position along the analysis line for Ca2+ waves evoked by stimuli of varying intensity in the cell shown in (A). As stimulation intensity increased, so did the extent to which Ca2+ waves propagated toward and into the soma. The 70 μA stimulus evoked one action potential in one trial and no action potentials in a second trial. (C) Puffs of ACPD (30–200 ms) onto the ferret cell shown at left triggered Ca2+ waves that originated in the primary apical dendrite and propagated bidirectionally. Longer puffs triggered more extensively propagating Ca2+ waves and larger somatic [Ca2+]i rises. Longer puffs also evoked greater membrane hyperpolarizations.
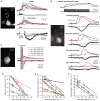
Figure 7
Long uncaging flashes close to the soma evoked more substantial somatic [Ca2+]i rises and hyperpolarizations than did shorter or more distal uncaging flashes. (A1) Alexa fluorescence image of a rat neuron filled with fluo-4 (100 μM) and NPE-caged IP3 (97 μM) showing regions of interest (ROIs) and the location of the pseudo-linescan. (A2) UV flashes (200, 300, and 500 ms durations) from a beam directed at the primary apical dendrite (35 and 68 μm from the soma center) triggered Ca2+ waves and transient membrane hyperpolarizations. The amplitude of somatic [Ca2+]i rises and the magnitude of evoked hyperpolarizations were greater for longer flashes and smaller when the uncaging beam was moved away from the soma. The delay to hyperpolarization onset increased when the uncaging beam was moved away from the soma but was approximately constant for all flashes at a given location. Electrical traces are overlaid for comparison at the bottom of the figure. (B) Hyperpolarizations were evoked by UV flashes of variable duration (50, 100, 200, and 300 ms) from a beam directed at the primary apical dendrite 23 μm from the soma center in a different rat cell filled with NPE-caged IP3 (97 μM). Longer UV flashes evoked hyperpolarizations with greater magnitudes. The delay to hyperpolarization onset was approximately constant for all flash durations. Data for this cell are plotted in red in (C). (C) Hyperpolarization magnitude versus flash duration for 7 rat cells. Longer uncaging flashes evoked greater hyperpolarizations. (D) UV flashes of constant duration from a beam directed at variable locations (16, 43, 76, and 83 μm from the soma center) evoked hyperpolarizations in a different rat cell filled with NPE-caged IP3 (97 μM). Hyperpolarization magnitude decreased and delay to hyperpolarization onset increased as the uncaging beam was moved away from the soma. Data for this cell are plotted in red in (E, F). (E) Hyperpolarization magnitude versus uncaging location for 7 rat cells. Flashes proximal to the soma evoked greater hyperpolarizations than more distal flashes. (F) Delay to hyperpolarization onset versus uncaging location for the same 7 cells shown in (E). The delay to hyperpolarization onset was smaller for proximal flashes than for distal flashes.
Figure 8
Priming facilitated the propagation of Ca2+ waves into and through the soma and enhanced the hyperpolarization and depolarization. (A) Trains of synaptic stimulation (30 pulses at 100 Hz) evoked Ca2+ waves in the primary apical dendrite and a basal dendrite of the rat cell shown at left. When the stimulus was preceded by a spike train (17 Hz, 3 s), the Ca2+ waves propagated into and through the soma and were accompanied by a distinct hyperpolarization. Ca2+ waves triggered by the same stimulation but without prior spike train priming propagated shorter distances, had smaller amplitude in the soma, and were not accompanied by distinct hyperpolarizations. (B) Puffs of ACPD (30 ms) were applied onto this rat neuron at variable intervals following priming spike trains (17 Hz, 3 s). The maximum amplitude of somatic [Ca2+]i rises, as well as the magnitudes of the hyperpolarization and depolarization, decreased as the amount of time since priming increased. (C) UV flashes over the soma of a rat cell filled with NPE-caged IP3 (97 μM) triggered [Ca2+]i rises and hyperpolarizations. Both the maximum amplitude of somatic [Ca2+]i rises and the hyperpolarization magnitude decreased as the amount of time since priming increased. Optical data shown here were corrected for the tissue autofluorescence that results from exposure to the uncaging beam. (D) Maximum amplitude of ACPD puff-evoked somatic [Ca2+]i rises versus time since priming for 5 rat cells. The amplitude of [Ca2+]i rises in the soma correlated negatively (P <0.05) with the amount of time since priming for all 5 cells. (E) The magnitude of the hyperpolarization triggered by puffs of ACPD or by uncaging of NPE-caged IP3 versus time since priming for 9 rat cells. Hyperpolarization magnitude correlated negatively (P <0.05) with the amount of time since priming for all 9 cells. (F) The magnitude of the ACPD puff–evoked depolarization versus time since priming for 6 rat cells. Depolarization magnitude decreased as the amount of time since priming increased for all 6 cells. A negative correlation (P<0.05) was seen for only 3 of the 6 cells.
Similar articles
- Modulation of calcium wave propagation in the dendrites and to the soma of rat hippocampal pyramidal neurons.
Watanabe S, Hong M, Lasser-Ross N, Ross WN. Watanabe S, et al. J Physiol. 2006 Sep 1;575(Pt 2):455-68. doi: 10.1113/jphysiol.2006.114231. Epub 2006 Jun 29. J Physiol. 2006. PMID: 16809362 Free PMC article. - Metabotropic glutamate receptors regulate hippocampal CA1 pyramidal neuron excitability via Ca²⁺ wave-dependent activation of SK and TRPC channels.
El-Hassar L, Hagenston AM, D'Angelo LB, Yeckel MF. El-Hassar L, et al. J Physiol. 2011 Jul 1;589(Pt 13):3211-29. doi: 10.1113/jphysiol.2011.209783. Epub 2011 May 16. J Physiol. 2011. PMID: 21576272 Free PMC article. - Hippocampal mossy fiber activity evokes Ca2+ release in CA3 pyramidal neurons via a metabotropic glutamate receptor pathway.
Kapur A, Yeckel M, Johnston D. Kapur A, et al. Neuroscience. 2001;107(1):59-69. doi: 10.1016/s0306-4522(01)00293-7. Neuroscience. 2001. PMID: 11744247 Free PMC article. - Developing a neuronal model for the pathophysiology of schizophrenia based on the nature of electrophysiological actions of dopamine in the prefrontal cortex.
Yang CR, Seamans JK, Gorelova N. Yang CR, et al. Neuropsychopharmacology. 1999 Aug;21(2):161-94. doi: 10.1016/S0893-133X(98)00112-2. Neuropsychopharmacology. 1999. PMID: 10432466 Review. - Calcium dependence of native metabotropic glutamate receptor signaling in central neurons.
Tabata T, Kano M. Tabata T, et al. Mol Neurobiol. 2004 Jun;29(3):261-70. doi: 10.1385/MN:29:3:261. Mol Neurobiol. 2004. PMID: 15181238 Review.
Cited by
- PERK Regulates Working Memory and Protein Synthesis-Dependent Memory Flexibility.
Zhu S, Henninger K, McGrath BC, Cavener DR. Zhu S, et al. PLoS One. 2016 Sep 14;11(9):e0162766. doi: 10.1371/journal.pone.0162766. eCollection 2016. PLoS One. 2016. PMID: 27627766 Free PMC article. - Understanding calcium waves and sparks in central neurons.
Ross WN. Ross WN. Nat Rev Neurosci. 2012 Feb 8;13(3):157-68. doi: 10.1038/nrn3168. Nat Rev Neurosci. 2012. PMID: 22314443 Free PMC article. Review. - Dendritic Signaling in Inhibitory Interneurons: Local Tuning via Group I Metabotropic Glutamate Receptors.
Camiré O, Lacaille JC, Topolnik L. Camiré O, et al. Front Physiol. 2012 Jul 9;3:259. doi: 10.3389/fphys.2012.00259. eCollection 2012. Front Physiol. 2012. PMID: 22934015 Free PMC article. - Cholinergic induction of input-specific late-phase LTP via localized Ca2+ release in the visual cortex.
Cho KH, Jang HJ, Jo YH, Singer W, Rhie DJ. Cho KH, et al. J Neurosci. 2012 Mar 28;32(13):4520-30. doi: 10.1523/JNEUROSCI.4577-11.2012. J Neurosci. 2012. PMID: 22457499 Free PMC article. - Stress signalling pathways that impair prefrontal cortex structure and function.
Arnsten AF. Arnsten AF. Nat Rev Neurosci. 2009 Jun;10(6):410-22. doi: 10.1038/nrn2648. Nat Rev Neurosci. 2009. PMID: 19455173 Free PMC article. Review.
References
- Adkins CE, Taylor CW. Lateral inhibition of inositol 1,4,5-trisphosphate receptors by cytosolic Ca(2+) Curr Biol. 1999;9:1115–1118. - PubMed
- Anwyl R. Metabotropic glutamate receptors: electrophysiological properties and role in plasticity. Brain Res Brain Res Rev. 1999;29:83–120. - PubMed
- Bartus RT, Levere TE. Frontal decortication in rhesus monkeys: a test of the interference hypothesis. Brain Res. 1977;119:233–248. - PubMed
- Batuev AS, Kursina NP, Shutov AP. Unit activity of the medial wall of the frontal cortex during delayed performance in rats. Behav Brain Res. 1990;41:95–102. - PubMed
- Bekkers JM. Distribution of slow AHP channels on hippocampal CA1 pyramidal neurons. J Neurophysiol. 2000;83:1756–1759. - PubMed
Publication types
MeSH terms
Substances
Grants and funding
- R01-MH067830/MH/NIMH NIH HHS/United States
- P50-MH068789/MH/NIMH NIH HHS/United States
- R01 MH067830/MH/NIMH NIH HHS/United States
- P50 MH068789/MH/NIMH NIH HHS/United States
- R01 MH067830-03/MH/NIMH NIH HHS/United States
- RL1 AA017536/AA/NIAAA NIH HHS/United States
LinkOut - more resources
Full Text Sources
Miscellaneous


