Genome position and gene amplification - PubMed (original) (raw)
Genome position and gene amplification
Pavla Gajduskova et al. Genome Biol. 2007.
Abstract
Background: Amplifications, regions of focal high-level copy number change, lead to overexpression of oncogenes or drug resistance genes in tumors. Their presence is often associated with poor prognosis; however, the use of amplification as a mechanism for overexpression of a particular gene in tumors varies. To investigate the influence of genome position on propensity to amplify, we integrated a mutant form of the gene encoding dihydrofolate reductase into different positions in the human genome, challenged cells with methotrexate and then studied the genomic alterations arising in drug resistant cells.
Results: We observed site-specific differences in methotrexate sensitivity, amplicon organization and amplification frequency. One site was uniquely associated with a significantly enhanced propensity to amplify and recurrent amplicon boundaries, possibly implicating a rare folate-sensitive fragile site in initiating amplification. Hierarchical clustering of gene expression patterns and subsequent gene enrichment analysis revealed two clusters differing significantly in expression of MYC target genes independent of integration site.
Conclusion: These studies suggest that genome context together with the particular challenges to genome stability experienced during the progression to cancer contribute to the propensity to amplify a specific oncogene or drug resistance gene, whereas the overall functional response to drug (or other) challenge may be independent of the genomic location of an oncogene.
Figures
Figure 1
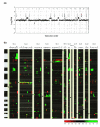
Parental DHFR* integration sites and copy number aberrations in methotrexate resistant colonies. (a) Copy number profile of cell line HCT116+chr3 and positions of 13 DHFR* integrations. This near-diploid cell line is characterized by partial chromosomal gains on chromosomes 3, 8, 10, 12, 16, losses on chromosomes 4, 16 and 10 and homozygous deletion on chromosome 16. Shown are the log2 ratios on BAC clones ordered according to genome position (UCSC Genome Browser, May 2004 freeze). Arrows indicate the positions of integration of one copy of DHFR* as mapped by inverse PCR to the human genome sequence. (b) Heatmap representation of copy number changes detected by array CGH in 82 methotrexate resistant colonies from 12 different insertion sites. Each column represents one resistant colony. Resistant colonies from each DHFR* integration site were clustered according to their copy number changes. Positions of the insertion sites are indicated by the arrowheads. Individual BAC clones are shown as rows and ordered according to their genome position (UCSC Genome Browser, May 2004 freeze). Copy number losses are indicated in red, gains in green and amplifications as yellow dots.
Figure 2
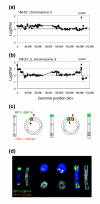
Mechanism of DHFR* amplification involving a ring chromosome intermediate. (a) Chromosome 3 copy number profile in untreated 1M-57 cells. Shown are the log2 ratios ordered according to position on the May 2004 freeze of the human genome sequence. The copy number gain extending from 3pter to RP11-233L3 reflects the presence of the two normal copies of chromosome 3 and the additional piece of chromosome 3 in HCT116+chr3 cells. The DHFR* insertion site is indicated by the arrowhead. (b) Chromosome 3 copy number profile in methotrexate resistant colony 1M-57_2. Two regions of amplification are evident at 3pter and near the distal end of 3q. Copy number losses include material from 3p and 3qter distal to DHFR*. (c) Proposed mechanism leading to amplification of the region around DHFR*. The ends of chromosome 3 fuse to create a ring chromosome with loss of material distal to DHFR* on 3q. Breakage at positions indicated by the arrowheads at anaphase results in the metacentric chromosome that now carries duplication of juxtaposed 3p and 3q sequences. The process can be repeated to generate additional copies of the 3p and 3q sequences. (d) FISH with RP11-107D22 (red), which contains sequences flanking the DHFR* integration site on 3q and RP11-28P14 (green), which maps to 3p. Shown are pseudocolor images showing hybridization signals on the chromosomes and the corresponding DAPI image (gray).
Figure 3
Amplicons formed by two genomic regions, initially located on the different chromosomes. Chromosome 8 and 9 copy number profiles showing amplification on (a) 9q and (b) 8q. (c) Organization of the amplicon. CTD-3145B15 (red) maps to the 9q telomere near the DHFR* insertion site and RP11-237F24 (green) to the region of amplification on chromosome 8 shown in (b). The chromosome 9 signals appear to flank the chromosome 8 material on this chromosome. Amplification of the region around DHFR* is indicated by the large hybridization signal from CTD-3145B15. The amplified DNA was determined to be located on chromosome 9 by hybridization of RP11-62H18 to 9pter (not shown). Thus, material from 9qter appears to be amplified in situ on chromosome 9 and additional copies of material from the chromosome 9 amplicon are present on a separate chromosome together with amplified DNA from chromosome 8. (d, e) Copy number profiles of chromosomes 19 (d) and 8 (e). (f) Organization of the amplicon. RP11-691H23 (red) maps near the DHFR* integration site on chromosome 19 and RP11-175H20 (green) is one of the clones from the amplicon on chromosome 8 shown in (e). The chromosome 19 signals appear to flank a number of copies of chromosome 8, which could be as many as eight copies, since the CGH log2 ratio = ~2. Two additional copies of RP11-691H23, mapping near DHFR* on chromosome 19, were also present on chromosome 19 (data not shown). Thus, amplified DNA near the DHFR* integration site is present and independently amplified on two chromosomes. (g, h) 1M-42_9 CGH profile (chromosome 8) showing the DHFR* amplicon and its organization as determined by FISH. BAC clone RP11-91O11 (red) maps near the DHFR* integration site and is co-amplified with the distal part of chromosome 8 (RP11-237F24, green). The chromosomal region between the two co-amplified regions was lost. (i, j) 1M-42_2 CGH profile (chromosome 8) and FISH analysis showing that the two regions of chromosome 8 were amplified as two independent amplicons on different chromosomes.
Figure 4
Recurrent amplicon boundaries in 1M-42 methotrexate resistant clones and fragile sites. (a) Chromosome 8 copy number profiles at approximately 1.4 Mb resolution. The vertical lines indicate the region from 99 to 105 Mb on chromosome 8 shown for (b) hybridization of these same DNAs to the 32K genome tiling array.
Figure 5
Expression of genes mapping to the amplicon from methotrexate resistant colony 1M-89_6. (a) Chromosome 19 copy number profile at approximately 1.4 Mb resolution (HumArray3.0) shows four discrete regions of amplification. (b) Chromosome 19 copy number profile from the 32K BAC genome tiling path array in the amplified region showing the four regions of amplification detected on the lower resolution array and an additional small region distal to the others. The regions, ranging in size from 0.2 to 1.2 Mb, were amplified together in some cells as double minutes, while in others the amplified DNA was integrated into different chromosomes and present as a homogeneously staining region. Both copies of chromosome 19 were retained without rearrangement. As all regions are included together on the double minutes, their formation may have occurred by joining of broken pieces of DNA subsequent to resolution of stalled replication forks [63]. (c) Expression levels of genes mapping to the five amplified regions plotted according to position on the human genome sequence. Expression levels are shown as the log2 ratios of the signal intensities after hybridization of Cy3 labeled cDNA from the methotrexate resistant colony and Cy5 labeled cDNA from the untreated parent 1M-89 as reference. Shown is the list of genes in genomic order that map to the amplified regions according to the RefSeq database [64]. Genes that are expressed in this cell line with or without exposure to methotrexate are labeled in black and expression levels denoted by black dots. Genes present on the array, but not expressed in untreated or resistant cells, are colored by dark gray and represented by dots of the same color with zero change in expression. Genes not present on the array are listed in the upper line in light gray. Genes with log2 fold change >0.8 are indicated with an asterisk.
Figure 6
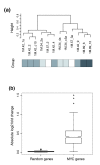
Expression profiling of 12 methotrexate resistant colonies with amplification of DHFR*. (a) Unsupervised hierarchical clustering (Pearson) of genes with variable expression across the data set (SD ≥ 0.3) and present in >75% of samples (3,931 genes). Methotrexate resistant colonies represent four different integration sites, indicated by the shaded boxes below the dendrogram. (b) Comparison of expression of MYC target genes in the two clusters. The median absolute log2 ratio change in expression of MYC target genes in the right cluster compared to the left cluster is significantly higher than a similar comparison using 1,000 sets of 380 randomly selected genes (p = 2.2e-16).
Figure 7
Positions of DHFR* integration sites and fragile sites. The DHFR* integration sites were mapped onto the genome using BLAT [46] and are shown as a red bar on the chromosome ideogram from the UCSC genome browser [45]. Common fragile sites are shown under the chromosome and are mapped according to positions reported in NCBI Entrez and the literature [65-77]. Rare folate sensitive fragile sites are shown above the chromosome. Note that the 1M-45_DHFR_* integration site mapped just proximal to FRA11B, another folate sensitive fragile site; however, no copy number transitions or amplicon boundaries mapped to this region. Since FRA11B is a RFS, it may not be expressed in HCT116.
Similar articles
- Stimulation of methotrexate resistance and dihydrofolate reductase gene amplification by c-myc.
Denis N, Kitzis A, Kruh J, Dautry F, Corcos D. Denis N, et al. Oncogene. 1991 Aug;6(8):1453-7. Oncogene. 1991. PMID: 1886715 - Mechanisms of methotrexate resistance in osteosarcoma.
Guo W, Healey JH, Meyers PA, Ladanyi M, Huvos AG, Bertino JR, Gorlick R. Guo W, et al. Clin Cancer Res. 1999 Mar;5(3):621-7. Clin Cancer Res. 1999. PMID: 10100715 - Molecular mechanisms of resistance to antifolates, a review.
Banerjee D, Ercikan-Abali E, Waltham M, Schnieders B, Hochhauser D, Li WW, Fan J, Gorlick R, Goker E, Bertino JR. Banerjee D, et al. Acta Biochim Pol. 1995;42(4):457-64. Acta Biochim Pol. 1995. PMID: 8852336 Review. - Gene amplification and altered enzymes as mechanisms for the development of drug resistance.
Bertino JR, Carman MD, Weiner HL, Cashmore A, Moroson BA, Srimatkandada S, Schornagel JH, Medina WD, Dube SK. Bertino JR, et al. Cancer Treat Rep. 1983 Oct;67(10):901-4. Cancer Treat Rep. 1983. PMID: 6354438 Review.
Cited by
- Gene amplification in human cells knocked down for RAD54.
Ruiz-Herrera A, Smirnova A, Khoriauli L, Nergadze SG, Mondello C, Giulotto E. Ruiz-Herrera A, et al. Genome Integr. 2011 Mar 18;2(1):5. doi: 10.1186/2041-9414-2-5. Genome Integr. 2011. PMID: 21418575 Free PMC article. - Cancer quasispecies and stem-like adaptive aneuploidy.
Napoletani D, Signore M, Struppa DC. Napoletani D, et al. F1000Res. 2013 Dec 6;2:268. doi: 10.12688/f1000research.2-268.v1. eCollection 2013. F1000Res. 2013. PMID: 24715964 Free PMC article. - Regulatory mechanisms that prevent re-initiation of DNA replication can be locally modulated at origins by nearby sequence elements.
Richardson CD, Li JJ. Richardson CD, et al. PLoS Genet. 2014 Jun 19;10(6):e1004358. doi: 10.1371/journal.pgen.1004358. eCollection 2014 Jun. PLoS Genet. 2014. PMID: 24945837 Free PMC article. - The DNA damage-binding protein XPC is a frequent target for inactivation in squamous cell carcinomas.
de Feraudy S, Ridd K, Richards LM, Kwok PY, Revet I, Oh D, Feeney L, Cleaver JE. de Feraudy S, et al. Am J Pathol. 2010 Aug;177(2):555-62. doi: 10.2353/ajpath.2010.090925. Epub 2010 Jul 8. Am J Pathol. 2010. PMID: 20616346 Free PMC article. - Gene amplification as double minutes or homogeneously staining regions in solid tumors: origin and structure.
Storlazzi CT, Lonoce A, Guastadisegni MC, Trombetta D, D'Addabbo P, Daniele G, L'Abbate A, Macchia G, Surace C, Kok K, Ullmann R, Purgato S, Palumbo O, Carella M, Ambros PF, Rocchi M. Storlazzi CT, et al. Genome Res. 2010 Sep;20(9):1198-206. doi: 10.1101/gr.106252.110. Epub 2010 Jul 14. Genome Res. 2010. PMID: 20631050 Free PMC article.
References
- Miele M, Bonatti S, Menichini P, Ottaggio L, Abbondandolo A. The presence of amplified regions affects the stability of chromosomes in drug-resistant Chinese hamster cells. Mutat Res. 1989;219:171–178. - PubMed
Publication types
MeSH terms
Substances
LinkOut - more resources
Full Text Sources
Molecular Biology Databases


