High-resolution electron microscopy of helical specimens: a fresh look at tobacco mosaic virus - PubMed (original) (raw)
High-resolution electron microscopy of helical specimens: a fresh look at tobacco mosaic virus
Carsten Sachse et al. J Mol Biol. 2007.
Abstract
The treatment of helical objects as a string of single particles has become an established technique to resolve their three-dimensional (3D) structure using electron cryo-microscopy. It can be applied to a wide range of helical particles such as viruses, microtubules and helical filaments. We have made improvements to this approach using Tobacco Mosaic Virus (TMV) as a test specimen and obtained a map from 210,000 asymmetric units at a resolution better than 5 A. This was made possible by performing a full correction of the contrast transfer function of the microscope. Alignment of helical segments was helped by constraints derived from the helical symmetry of the virus. Furthermore, symmetrization was implemented by multiple inclusions of symmetry-related views in the 3D reconstruction. We used the density map to build an atomic model of TMV. The model was refined using a real-space refinement strategy that accommodates multiple conformers. The atomic model shows significant deviations from the deposited model for the helical form of TMV at the lower-radius region (residues 88 to 109). This region appears more ordered with well-defined secondary structure, compared with the earlier helical structure. The RNA phosphate backbone is sandwiched between two arginine side-chains, stabilizing the interaction between RNA and coat protein. A cluster of two or three carboxylates is buried in a hydrophobic environment isolating it from neighboring subunits. These carboxylates may represent the so-called Caspar carboxylates that form a metastable switch for viral disassembly. Overall, the observed differences suggest that the new model represents a different, more stable state of the virus, compared with the earlier published model.
Figures
Figure 1
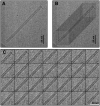
Segmentation Procedure: (A) A typical TMV rod embedded in vitreous ice. (B) Segmentation of a virus particle into segments with an overlap of 90 % and dimensions of 7.4 × 7.4 nm. Note that the original orientation of the virus is retained and the approximate in-plane rotation angle is recorded in a list. (C) In this example, a virus of 290 nm length yields 28 overlapping segments that are collected on an image stack as a starting point for single-particle processing.
Figure 2
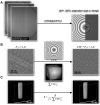
CTF-correction: (A) Determination of microscope parameters: a stack of micrographs serves as input for the computer programs CTFFIND/CTFTILT to determine the microscope parameters, i.e. image defocus ΔDF1/ΔDF2, astigmation angle α and tilt of the micrograph (left). The graphical output of CTFFIND contains an image that is divided into a simulated power spectrum half of the determined CTF and averaged power spectrum half of the micrograph (right). Micrographs were binned six times before CTF determination in order to enhance the signal. (B) Convolution with determined CTF: the windowed segment Pi on the left (Figure 1) is multiplied with the simulated CTFi in Fourier space (center) resulting in a phase-corrected and amplitude-weighted segment at the right. The corrected image stack is used for alignment and reconstruction. (C) Amplitude correction in 3D: in parallel, for all individual segments, their astigmatic (CTF3D) (3D power spectrum in the center) are summed and the final 3D reconstruction of the corrected images (left) is deconvoluted by this sum to yield the corrected 3D reconstruction (right). The CTF correction scheme was adapted from Grigorieff ; .
Figure 3
Flowchart of data processing. Major adaptations of the IRSHR procedure are highlighted in red: (A) Segments are (B) CTF-corrected and processed (C) in an iterative reconstruction cycle based on projection matching. Projection: A low-resolution model serves as a reference and is projected around its helical axis in 1° increments. As the model becomes more refined out-of-plane tilted projections ±0,1,2…12° are also generated. Alignment: Projections are matched with the overlapping segments extracted from the micrographs. Restraints on alignment are imposed derived from the continuity of the virus particle. 3D reconstruction: The orientational parameters are used to merge the segments into a 3D volume. Each image is inserted multiple times according to its symmetry-equivalent views.
Figure 4
Long-range curvature of a virus. (A) The reconstructed volume displayed at a 3σ threshold. The center of the segment shows stronger density than the upper and lower part due to the long-range curvature of the included viruses. (B) Analysis of the in-plane rotation angle along three viruses from micrographs taken at three different defoci.
Figure 5
Density map of TMV filtered at about 4.5 Å resolution. (A) Quarter slice of 20×20×2 nm through three adjacent subunits. (B) Density of a single turn comprising 16 subunits and superimposed atomic coordinates viewed parallel to the helical axis. (C) Three turns of 49 subunits. (D) 3D reconstruction of a 70×70×70 nm TMV rod segment from electron micrographs.
Figure 6
Error analysis of alignment parameters. (A) Histogram of x-shift differences from one segment to the next. (B) Correlation map of an image and its matched projection. Correlation peaks along x and y are plotted. Cross-correlation against three Euler angles: (C) in-plane rotation angle (D) out-of-plane rotation angle and (E) angle around the helical axis.
Figure 7
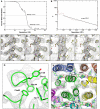
Assessment of resolution: (A) FSC between two reconstructions calculated from two halves of the data. (B) Fit of an exponential B-factor curve to the average structure factor of the cryo-EM map in resolution zones between 10 and 4 Å resolution. Comparison of density maps calculated from an atomic model at a resolution of (C) 4 (D) 5 (E) 6 Å and (F) the experimental cryo-EM map at a nominal resolution of 4.7 / 4.3 Å (FSC = 0.5 / 0.143). (G) Hydrophobic cluster with strong side-chain density (Phe12, Trp17, Phe62, Tyr139, Phe144) at higher radius of the subunit. (H) RNA located between four-helix bundles of lower and upper subunit neighbors at lower radius. The packed nucleobases exhibit strong density resolving a distance of approximately 4 Å. (α-helical ribbon of the same color originate from a single subunit.)
Figure 8
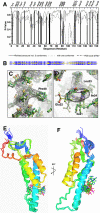
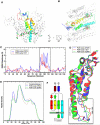
Multiconformer refinement of TMV. (A) Local CC-value of the atomic model evaluated for each residue in the protein sequence. The refined structure with a single conformer and an ensemble of five conformers are compared. The presentation of the refined structure as an ensemble of 5 conformers yields higher correlation than a single conformer alone. The ensemble of conformers accounts for the flexibility of the structure and uncertainty in the atomic coordinates. The TMV atomic model determined by X-ray fiber diffraction (PDB code 2TMV) shows significant disagreement with the density between residues 88 and 109 (22 residues). Black bars indicate clearly identified residues corresponding to strong density and high local CC-values due to their bulky side chains. These residues served as guide points in the building of the new atomic model. (B) Protein secondary structure assignment determined by PROCHECK . (C) Example of well-defined density of bulky phenylalanine 48. (D) By contrast, side-chain conformations of smaller residues are not clearly defined by the density (Ile21, Glu22, Ile24), here seen along the LS helix. (E, F) Two orthogonal views of a single TMV subunit displayed as an ensemble of five different conformers.
Figure 9
(A, B) Two orthogonal views of the average structure and adjacent subunits including RNA. (C) RMS deviation per residue between earlier atomic models of TMV and the refined average coordinates derived from the cryo-EM map. Residues 88 to 109 show major deviations. (D) Superimposition of TMV structures. Green: refined average structure derived from the cryo-EM map (PDB code 2OM3), blue: PDB code 2TMV – the helical virus derived from X-ray fiber diffraction , red: PDB code 1EI7 – four-layer-disk-aggregate . (E) Comparison of the radial density distribution filtered to about 10 Å. Green: PDB code 2OM3, blue: PDB code 2TMV, black: experimental distribution determined by Franklin and Holmes 1958 . The calculated density distributions for the atomic models include a correction for solvent scattering . (F) Simplified topology of tertiary structure based on the cryo-EM map. The names of the helices are assigned according to the 2TMV structure. New elements include an extended RR helix with an additional 310 helical turn and an extended LR helix. The V-column forms a high-density stretch at the inner wall of the virus .
Figure 10
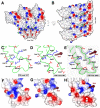
(A, B) Electrostatic potential of the atomic model based on the cryo-EM structure in two orthogonal views. The phosphates of the RNA are neutralized by two arginines at position 90 and 92. The extended RR-helix, V-column and extended RL-helix form the boundaries of the “carboxyl cage” which harbors negatively charged residues Glu97 and Glu106 pointing towards the interior of the subunit. Glu95 and Asp116/Asp109 from the adjacent subunit form another carboxylate cluster. Comparison of (C) disk-aggregate (PDB code 1EI7), (D) helical TMV structure from X-ray fiber diffraction (PDB code 2TMV), and (E) helical TMV structure from cryo-EM (PDB code 2OM3) at lower radius. Positively and negatively charged residues are highlighted in blue and red, respectively. (E) The experimental cryo-EM density is superimposed on the refined atomic coordinates in chicken-wire style. Upon RNA-binding the Arg92 switches in conformation to sandwich the negatively charged phosphate groups with Arg90. Magnified inner-radius region of the solvent-accessible surface colored with the electrostatic potential calculated from the atomic coordinates of the disk aggregate (F), helical TMV from X-ray fiber diffraction (G), and helical TMV from the cryo-EM density (H).
Figure11
Summary of the putative disassembly/assembly mechanism of TMV. The structural conversion from the helical into the disk-aggregate form can be induced by a change in pH. The atomic models of two adjacent subunits of the coat protein from the lower and upper layer of the three determined structures are displayed. Negatively and positively (red and blue) charged residues are highlighted because of their importance in the assembly/disassembly process. The grey color of the disk-structure main chain at the inner wall presents the disordered backbone with a B-factor greater than 100. (A) The cryo-EM structure (PDB code 2OM3) might represent the stable state of the helical TMV because of its high secondary structure order: the intrasubunit carboxylate cluster (Glu97, Glu106 and possibly Asp109) acts as a metastable switch - here in the spring-loaded 'off' position. Upon a change in the environmental milieu (rise in pH) protons are lost from this cluster of residues and the switch is turned 'on', initiating the opening of the extended RR helical turn at lower radius. (B) The 2TMV structure can be interpreted as a transitional state between the helical form of TMV and the disk form: the loss of secondary structure in the lower-radius region affects the binding between adjacent subunits because of electrostatic repulsion between residues Glu95, Asp109 and Asp116 that are located in adjacent subunits. The loss of secondary structure also loosens the RNA binding to the coat protein that is mediated by the positively charged Arg90, Arg92, Arg112 and Arg113. The conformational change in the lower-radius region ultimately leads to RNA dissociation. (C) 1EI7 structure of the disk aggregate: the lower-radius regions of the protein subunits in the disk structure are further removed from each other compared with their arrangement in the helical forms of the virus. A decrease in pH is thought to promote RNA binding and reversal of the disassembly process.
Similar articles
- 4.6A Cryo-EM reconstruction of tobacco mosaic virus from images recorded at 300 keV on a 4k x 4k CCD camera.
Clare DK, Orlova EV. Clare DK, et al. J Struct Biol. 2010 Sep;171(3):303-8. doi: 10.1016/j.jsb.2010.06.011. Epub 2010 Jun 15. J Struct Biol. 2010. PMID: 20558300 Free PMC article. - Hydrogen-bonding networks and RNA bases revealed by cryo electron microscopy suggest a triggering mechanism for calcium switches.
Ge P, Zhou ZH. Ge P, et al. Proc Natl Acad Sci U S A. 2011 Jun 7;108(23):9637-42. doi: 10.1073/pnas.1018104108. Epub 2011 May 17. Proc Natl Acad Sci U S A. 2011. PMID: 21586634 Free PMC article. - Elucidation of the viral disassembly switch of tobacco mosaic virus.
Weis F, Beckers M, von der Hocht I, Sachse C. Weis F, et al. EMBO Rep. 2019 Nov 5;20(11):e48451. doi: 10.15252/embr.201948451. Epub 2019 Sep 19. EMBO Rep. 2019. PMID: 31535454 Free PMC article. - Switching in the self-assembly of tobacco mosaic virus.
Caspar DL, Namba K. Caspar DL, et al. Adv Biophys. 1990;26:157-85. doi: 10.1016/0065-227x(90)90011-h. Adv Biophys. 1990. PMID: 2082726 Review. - Cryo-EM Structure Determination Using Segmented Helical Image Reconstruction.
Fromm SA, Sachse C. Fromm SA, et al. Methods Enzymol. 2016;579:307-28. doi: 10.1016/bs.mie.2016.05.034. Epub 2016 Jun 28. Methods Enzymol. 2016. PMID: 27572732 Review.
Cited by
- Protease cleavage leads to formation of mature trimer interface in HIV-1 capsid.
Meng X, Zhao G, Yufenyuy E, Ke D, Ning J, Delucia M, Ahn J, Gronenborn AM, Aiken C, Zhang P. Meng X, et al. PLoS Pathog. 2012;8(8):e1002886. doi: 10.1371/journal.ppat.1002886. Epub 2012 Aug 23. PLoS Pathog. 2012. PMID: 22927821 Free PMC article. - 4.6A Cryo-EM reconstruction of tobacco mosaic virus from images recorded at 300 keV on a 4k x 4k CCD camera.
Clare DK, Orlova EV. Clare DK, et al. J Struct Biol. 2010 Sep;171(3):303-8. doi: 10.1016/j.jsb.2010.06.011. Epub 2010 Jun 15. J Struct Biol. 2010. PMID: 20558300 Free PMC article. - Helical reconstruction in RELION.
He S, Scheres SHW. He S, et al. J Struct Biol. 2017 Jun;198(3):163-176. doi: 10.1016/j.jsb.2017.02.003. Epub 2017 Feb 11. J Struct Biol. 2017. PMID: 28193500 Free PMC article. - Human CTP synthase filament structure reveals the active enzyme conformation.
Lynch EM, Hicks DR, Shepherd M, Endrizzi JA, Maker A, Hansen JM, Barry RM, Gitai Z, Baldwin EP, Kollman JM. Lynch EM, et al. Nat Struct Mol Biol. 2017 Jun;24(6):507-514. doi: 10.1038/nsmb.3407. Epub 2017 May 1. Nat Struct Mol Biol. 2017. PMID: 28459447 Free PMC article. - In vitro assembly of the Rous Sarcoma Virus capsid protein into hexamer tubes at physiological temperature.
Jaballah SA, Bailey GD, Desfosses A, Hyun J, Mitra AK, Kingston RL. Jaballah SA, et al. Sci Rep. 2017 Jun 6;7(1):2913. doi: 10.1038/s41598-017-02060-0. Sci Rep. 2017. PMID: 28588198 Free PMC article.
References
- Henderson R. Realizing the potential of electron cryo-microscopy. Quarterly Reviews of Biophysics. 2004;37:3–13. - PubMed
- Henderson R, Baldwin JM, Ceska TA, Zemlin F, Beckmann E, Downing KH. Model for the structure of bacteriorhodopsin based on high-resolution electron cryo-microscopy. J Mol Biol. 1990;213:899–929. - PubMed
- De Rosier DJ, Klug A. Reconstruction of Three Dimensional Structures from Electron M icrographs. Nature. 1968;217:130–134. - PubMed
- Yonekura K, Maki-Yonekura S, Namba K. Complete atomic model of the bacterial flagellar filament by electron cryomicroscopy. Nature. 2003;424:643–50. - PubMed
- Unwin N. Refined structure of the nicotinic acetylcholine receptor at 4A resolution. J Mol Biol. 2005;346:967–89. - PubMed
MeSH terms
Substances
LinkOut - more resources
Full Text Sources
Other Literature Sources
