Notch-RBP-J signaling controls the homeostasis of CD8- dendritic cells in the spleen - PubMed (original) (raw)
Notch-RBP-J signaling controls the homeostasis of CD8- dendritic cells in the spleen
Michele L Caton et al. J Exp Med. 2007.
Abstract
Signaling through Notch receptors and their transcriptional effector RBP-J is essential for lymphocyte development and function, whereas its role in other immune cell types is unclear. We tested the function of the canonical Notch-RBP-J pathway in dendritic cell (DC) development and maintenance in vivo. Genetic inactivation of RBP-J in the bone marrow did not preclude DC lineage commitment but caused the reduction of splenic DC fraction. The inactivation of RBP-J in DCs using a novel DC-specific deleter strain caused selective loss of the splenic CD8(-) DC subset and reduced the frequency of cytokine-secreting CD8(-) DCs after challenge with Toll-like receptor ligands. In contrast, other splenic DC subsets and DCs in the lymph nodes and tissues were unaffected. The RBP-J-deficient splenic CD8(-) DCs were depleted at the postprogenitor stage, exhibited increased apoptosis, and lost the expression of the Notch target gene Deltex1. In the spleen, CD8(-) DCs were found adjacent to cells expressing the Notch ligand Delta-like 1 in the marginal zone (MZ). Thus, canonical Notch-RBP-J signaling controls the maintenance of CD8(-) DCs in the splenic MZ, revealing an unexpected role of the Notch pathway in the innate immune system.
Figures
Figure 1.
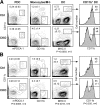
Decreased splenic DC content after RBP-J deletion in the BM. Control (RBP-Jfl/fl) or CKO (_RBP-Jfl/fl Mx1_-Cre+) mice were injected with poly(I):(C) to induce the deletion of RBP-J in the BM. 3 wk later, spleens were analyzed by flow cytometry, and BM was transferred to irradiated recipients. (A) Splenic DC compartment in control and CKO mice. Shown are the staining profiles of total splenocytes (or of B220+ splenocytes for PDCs), with the fraction of each population in the total splenocytes indicated (mean ± SD of three animals). (B) Splenic DC compartment in the chimeras established from control or CKO BM. Shown are the staining profiles of donor-derived (CD45.2+) splenocytes 4–5 wk after BM transfer, with the fraction of each population in the total donor-derived splenocytes indicated (mean ± SD of four to six animals). Student's test p-values are indicated for statistically significant differences.
Figure 2.
DC-specific Cre recombination in the _CD11c_-Cre deleter strain. Shown is the expression of the EYFP reporter gene in the _CD11c_-Cre+, _R26_-EYFP+ mice. Fluorescence profiles and percentages of EYFP+ cells are shown for the indicated cell populations (representative of three to five animals). No EYFP+ cells were detected in the absence of the Cre transgene (not depicted). (A) Major splenic cell lineages. (B) DC subsets, including splenic PDCs, CD8+ and CD8− DCs, activated DCs in the subcutaneous lymph nodes, and splenic DC progenitors. (C) Splenic myeloid cells (SSClow CD11b+), divided into four subsets based on Ly-6C and CD11c expression levels. Subset IV corresponds to differentiated CD8− DCs. FSC, forward scatter; SSC, side scatter.
Figure 3.
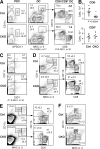
The loss of splenic CD8− DCs in mice with DC-specific RBP-J deletion. Spleens from control (RBP-Jfl/fl) and CKO (_RBP-Jfl/fl CD11c_-Cre+) mice were analyzed for the indicated cell populations. (A) Staining profiles of PDCs and conventional DCs, with the percentages among total splenocytes indicated (mean ± SD of 3 and 17 animals per genotype, respectively). Within the DC population, the mean percentages of CD8− and CD8+ DC subsets and the CD8−/CD8+ DC ratio are shown. (B) Absolute numbers of CD8− and CD8+ DCs in individual control (squares) and CKO (triangles) mice. Horizontal lines represent the means. (C) Staining of splenic DCs with the CD8− DC–specific mAb 33D1, with the fractions of 33D1+ and 33D1− DCs among total splenocytes indicated. A threefold decrease in the absolute number of 33D1+ DCs was observed in CKO spleens (not depicted). (D and E) DC populations in the cutaneous lymph nodes (D) and the thymus (E). Shown are the staining profiles of lineage-depleted cells, with blood-derived (CD11chigh MHC class II+) and mature tissue-derived (CD11c+ MHC class IIhigh) DC populations highlighted. The percentages of these populations among the total cells of each organ are indicated (mean ± SD of four mice). Within the blood-derived DC population, the fractions of CD8− and CD8+ subsets are shown (mean ± SD of four mice). (F) Staining profiles of alveolar macrophages (CD11chigh MHC class II+) and conventional resident DCs (CD11clow MHC class IIhigh) in the lung. The percentage of each population among total lung cells is indicated (mean ± SD of four mice).
Figure 4.
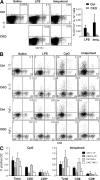
Decreased frequency of cytokine-secreting splenic DCs in the absence of RBP-J. (A) The frequency of IL-12–secreting DCs after TLR ligand challenge in vivo. Control (RBP-Jfl/fl) and CKO (_RBP-Jfl/fl CD11c_-Cre+) mice were injected with saline, LPS, or imiquimod, and IL-12 production in DCs was detected by intracellular staining. Shown are the representative staining profiles of MHC class II+ splenocytes and the frequency of IL-12+ DCs among total splenocytes (mean ± SD of four to five mice; P < 0.05 for both stimuli). (B and C) The frequency of cytokine-secreting DCs after TLR ligand challenge in vitro. Lymphoid lineage-depleted splenocytes were cultured in the presence of the indicated TLR ligands, and cytokine production in DCs was detected by intracellular staining for IL-12 and TNF-α. Shown are the representative staining profiles of CD11chigh MHC class II+ DCs (B) and the frequency of cytokine-secreting total and CD8− and CD8+ DCs among the splenocytes (C). The data represent the mean ± SD of three to four mice per genotype; the differences between control and CKO CD8− DCs are statistically significant (P = 0.0002 and P < 0.03 for CpG and imiquimod, respectively).
Figure 5.
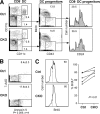
Impaired survival and homeostasis of RBP-J–deficient splenic CD8− DCs. (A) Splenic DC progenitors, including CD24low DC progenitors committed to the CD8− subset, in control (RBP-Jfl/fl) and CKO (_RBP-Jfl/fl CD11c_-Cre+) mice. The fraction of each subset in the gated population (mean of two animals) is indicated. The fraction of CD24−/low cells corresponding to CD8− DC progenitors is indicated by the vertical dotted line. (B) The expression of the apoptotic marker phosphatidylserine in control and CKO CD8− DCs, as determined by Annexin V staining. Shown are the representative profiles of ex vivo–isolated CD8− DCs stained with Annexin V and the dead-cell marker 7-amino-actinomycin D, with the fraction of apoptotic cells indicated (mean ± SD of four mice). (C) The turnover rate of splenic CD8− DCs. Mice were fed BrdU for 4–5 d, and the fraction of BrdU+ CD8− DCs (dotted line) was determined by flow cytometry. Shown are the representative BrdU staining profiles of gated CD8− DCs and the fraction of BrdU+ CD8− DCs in control and CKO mice. Because the efficiency of BrdU incorporation and staining varied between experiments, control and CKO mice from each experiment were compared pairwise and analyzed using the paired Student's t test.
Figure 6.
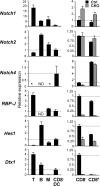
The expression of Notch pathway components in wild-type and RBP-J–deficient DCs. The expression of Notch receptors and target genes in splenic DCs was determined by qPCR. Shown are the expression levels of the indicated genes relative to the expression in wild-type CD8− DCs (indicated by the horizontal dashed line). The lack of signal above threshold is indicated by an asterisk. (left) The expression in splenic T or B lymphocytes, monocytes/macrophages (M), and CD8− DCs from wild-type mice. (right) The expression in CD8− and CD8+ DCs from control (RBP-Jfl/fl) and CKO (_RBP-Jfl/fl CD11c_-Cre+) mice. Results represent mean relative values ± SD of triplicate qPCR reactions. ND, not determined.
Figure 7.
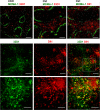
Localization of CD8− DCs and Dll1-expressing cells in the spleen. (top) Spleen sections from wild-type control (RBP-Jfl/fl) or CKO (_RBP-Jfl/fl CD11c_-Cre+) mice were stained for metallophilic macrophages delineating the MZ (MOMA-1+; green) and CD8− DCs (33D1; red). A serial section of control spleen was stained for MOMA1 (green) and Dll1 (red). (middle and bottom) Wild-type spleen sections were stained for CD8− DCs (33D1; green) and Dll1 (red). The location of 33D1+ cells in the MZ was confirmed by MOMA-1 staining of a serial section. Shown are the representative individual and merged images of 33D1 and Dll1 staining (middle) and a high magnification image of the area indicated by the dashed box (bottom). Bars: (top) 400 μm; (middle) 200 μm; (bottom) 100 μm.
Similar articles
- Notch signaling regulates the development of a novel type of Thy1-expressing dendritic cell in the thymus.
Ishifune C, Maekawa Y, Nishida J, Kitamura A, Tanigaki K, Yagita H, Yasutomo K. Ishifune C, et al. Eur J Immunol. 2011 May;41(5):1309-20. doi: 10.1002/eji.201041159. Epub 2011 Apr 12. Eur J Immunol. 2011. PMID: 21469122 - The transcription factor RBP-J-mediated signaling is essential for dendritic cells to evoke efficient anti-tumor immune responses in mice.
Feng F, Wang YC, Hu XB, Liu XW, Ji G, Chen YR, Wang L, He F, Dou GR, Liang L, Zhang HW, Han H. Feng F, et al. Mol Cancer. 2010 Apr 27;9:90. doi: 10.1186/1476-4598-9-90. Mol Cancer. 2010. PMID: 20420708 Free PMC article. - Deletion of RBP-J in dendritic cells compromises TLR-mediated DC activation accompanied by abnormal cytoskeleton reorganization.
Chen YR, Feng F, Wang L, Qu SY, Zhang ZQ, Liu L, Qin HY, Liang YM, Han H. Chen YR, et al. Mol Biol Rep. 2013 Feb;40(2):1531-9. doi: 10.1007/s11033-012-2198-3. Epub 2012 Nov 9. Mol Biol Rep. 2013. PMID: 23138187 - Two opposing roles of RBP-J in Notch signaling.
Tanigaki K, Honjo T. Tanigaki K, et al. Curr Top Dev Biol. 2010;92:231-52. doi: 10.1016/S0070-2153(10)92007-3. Curr Top Dev Biol. 2010. PMID: 20816397 Review. - Unique functions of splenic CD8alpha+ dendritic cells during infection with intracellular pathogens.
Neuenhahn M, Busch DH. Neuenhahn M, et al. Immunol Lett. 2007 Dec 15;114(2):66-72. doi: 10.1016/j.imlet.2007.09.007. Epub 2007 Oct 12. Immunol Lett. 2007. PMID: 17964665 Review.
Cited by
- Induction of a distinct macrophage population and protection from lung injury and fibrosis by Notch2 blockade.
Cruz Tleugabulova M, Melo SP, Wong A, Arlantico A, Liu M, Webster JD, Lau J, Lechner A, Corak B, Hodgins JJ, Garlapati VS, De Simone M, Korin B, Avraham S, Lund J, Jeet S, Reiss A, Bender H, Austin CD, Darmanis S, Modrusan Z, Brightbill H, Durinck S, Diamond MS, Schneider C, Shaw AS, Nitschké M. Cruz Tleugabulova M, et al. Nat Commun. 2024 Nov 6;15(1):9575. doi: 10.1038/s41467-024-53700-9. Nat Commun. 2024. PMID: 39505846 Free PMC article. - Suppression of melanoma by mice lacking MHC-II: Mechanisms and implications for cancer immunotherapy.
Shi H, Medler D, Wang J, Browning R, Liu A, Schneider S, Duran Bojorquez C, Kumar A, Li X, Quan J, Ludwig S, Moresco JJ, Xing C, Moresco EMY, Beutler B. Shi H, et al. J Exp Med. 2024 Dec 2;221(12):e20240797. doi: 10.1084/jem.20240797. Epub 2024 Oct 29. J Exp Med. 2024. PMID: 39470607 Free PMC article. - Dominant immune tolerance in the intestinal tract imposed by RelB-dependent migratory dendritic cells regulates protective type 2 immunity.
Geiselhöringer AL, Kolland D, Patt AJ, Hammann L, Köhler A, Kreft L, Wichmann N, Hils M, Ruedl C, Riemann M, Biedermann T, Anz D, Diefenbach A, Voehringer D, Schmidt-Weber CB, Straub T, Pasztoi M, Ohnmacht C. Geiselhöringer AL, et al. Nat Commun. 2024 Oct 23;15(1):9143. doi: 10.1038/s41467-024-53112-9. Nat Commun. 2024. PMID: 39443450 Free PMC article. - The expression of RBPJ and its potential role in rheumatoid arthritis.
Chen S, Zhao W, Du J, Chen S, Li J, Shen B, Zhou Y, Chen S. Chen S, et al. BMC Genomics. 2024 Sep 30;25(1):899. doi: 10.1186/s12864-024-10804-2. BMC Genomics. 2024. PMID: 39350019 Free PMC article. - Cohesin-mediated chromatin remodeling controls the differentiation and function of conventional dendritic cells.
Adams NM, Galitsyna A, Tiniakou I, Esteva E, Lau CM, Reyes J, Abdennur N, Shkolikov A, Yap GS, Khodadadi-Jamayran A, Mirny LA, Reizis B. Adams NM, et al. bioRxiv [Preprint]. 2024 Oct 30:2024.09.18.613709. doi: 10.1101/2024.09.18.613709. bioRxiv. 2024. PMID: 39345451 Free PMC article. Preprint.
References
- Steinman, R.M. 2003. Some interfaces of dendritic cell biology. APMIS. 111:675–697. - PubMed
- Shortman, K., and Y.J. Liu. 2002. Mouse and human dendritic cell subtypes. Nat. Rev. Immunol. 2:151–161. - PubMed
- Dudziak, D., A.O. Kamphorst, G.F. Heidkamp, V.R. Buchholz, C. Trumpfheller, S. Yamazaki, C. Cheong, K. Liu, H.W. Lee, C.G. Park, et al. 2007. Differential antigen processing by dendritic cell subsets in vivo. Science. 315:107–111. - PubMed
- Naik, S.H., D. Metcalf, A. van Nieuwenhuijze, I. Wicks, L. Wu, M. O'Keeffe, and K. Shortman. 2006. Intrasplenic steady-state dendritic cell precursors that are distinct from monocytes. Nat. Immunol. 7:663–671. - PubMed
- Neuenhahn, M., K.M. Kerksiek, M. Nauerth, M.H. Suhre, M. Schiemann, F.E. Gebhardt, C. Stemberger, K. Panthel, S. Schroder, T. Chakraborty, et al. 2006. CD8alpha+ dendritic cells are required for efficient entry of Listeria monocytogenes into the spleen. Immunity. 25:619–630. - PubMed
Publication types
MeSH terms
Substances
LinkOut - more resources
Full Text Sources
Other Literature Sources
Molecular Biology Databases
Research Materials
