Loss of neprilysin function promotes amyloid plaque formation and causes cerebral amyloid angiopathy - PubMed (original) (raw)
Loss of neprilysin function promotes amyloid plaque formation and causes cerebral amyloid angiopathy
Wesley Farris et al. Am J Pathol. 2007 Jul.
Abstract
Cerebral deposition of the amyloid beta protein (Abeta), an invariant feature of Alzheimer's disease, reflects an imbalance between the rates of Abeta production and clearance. The causes of Abeta elevation in the common late-onset form of Alzheimer's disease (LOAD) are largely unknown. There is evidence that the Abeta-degrading protease neprilysin (NEP) is down-regulated in normal aging and LOAD. We asked whether a decrease in endogenous NEP levels can prolong the half-life of Abeta in vivo and promote development of the classic amyloid neuropathology of Alzheimer's disease. We examined the brains and plasma of young and old mice expressing relatively low levels of human amyloid precursor protein and having one or both NEP genes silenced. NEP loss of function 1) elevated whole-brain and plasma levels of human Abeta(40) and Abeta(42), 2) prolonged the half-life of soluble Abeta in brain interstitial fluid of awake animals, 3) raised the concentration of Abeta dimers, 4) markedly increased hippocampal amyloid plaque burden, and 5) led to the development of amyloid angiopathy. A approximately 50% reduction in NEP levels, similar to that reported in some LOAD brains, was sufficient to increase amyloid neuropathology. These findings demonstrate an important role for proteolysis in determining the levels of Abeta and Abeta-associated neuropathology in vivo and support the hypothesis that primary defects in Abeta clearance can cause or contribute to LOAD pathogenesis.
Figures
Figure 1
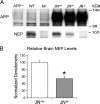
Cerebral APP and NEP levels in NP-40 brain fractions. A: A representative Western blot comparing levels of human APP (antibody 8E5) and endogenous NEP (antibody 56C6) in equal amounts of brain protein from the three JN lines at age 6 months. Control mice are APP knockout (APP−/−), wild-type (WT), and NEP knockout (N−/−). Densitometric comparison of the APP and CTF bands (not shown) among the three JN lines on three separate Western blots (n = 16 samples) revealed no significant difference. B: Comparison of relative NEP protein levels by densitometric analysis of quantitative Western blots (n = 13 JN+/+ and 14 JN+/− brains on three separate Western blots. For each blot, densitometry scores were normalized to the mean JN+/+ score, allowing combination of data sets). Bars represent the mean normalized densitometry score ± SEM. *P < 0.00005 by Student’s two-tailed _t_-test.
Figure 2
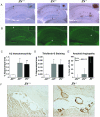
Disruption of NEP increases cerebral Aβ pathology at 13 months. A: Aβ immunoreactivity to antibody R1282 in sagittal sections of hippocampi (magnification, ×2) from mice representative of each line. Each section is from a mouse with the median degree of pathology for its genotype. The insets (magnification, ×20) show plaque morphology. B: Thioflavin-S staining of sections adjacent to those in A demonstrates deposition of fibrillar Aβ. Arrows in A and B mark a representative plaque in each brain positively stained by both the anti-Aβ antibody and thioflavin-S. Mean percentage of the hippocampal area with positive Aβ (C) or thioflavin-S (D) staining as determined by computer-assisted image analysis for each experimental group. Bars represent the group mean ± SEM (n = 20 JN+/+, 11 JN+/−, and 8 JN−/−; *P < 0.0005; **P = 0.00001 compared with JN+/+). F: Blood vessels in the hippocampal fissure on sagittal brain sections stained by Aβ immunohistochemistry reveals prominent CAA in the JN−/− mouse. E: Graph represents the percentage of mice with CAA by genotype and the 95% confidence intervals (CI) on these proportions as determined by the modified Wald method. The JN−/− CI does not overlap with those of the JN+/+or JN+/− mice. n = 22 JN+/+, 13 JN+/−, and 8 JN−/−.
Figure 3
Figure 3. Quantification of Aβ40 and Aβ42 in brain and plasma at 3, 6, and 13 months in NEP-deficient mice. ELISAs specific for human Aβ40 (A and C) and Aβ42 (B and D) were performed on the GuHCl brain extracts (A and B) and plasma (C and D). Bars represent the mean values ± SEM (n = 8 to 18 mice per group). No JN+/− brains were examined at 3 months. Because of the tremendous increase in cerebral Aβ42 with age, the 13-month Aβ42 brain data are shown with a differently scaled y axis than the 3- and 6-month data (compared with JN+/+, *P < 0.05; **P ≤ 0.01; ***P < 0.0005. JN+/− compared with JN−/−, #P < 0.05; ##P < 0.01).
Figure 4
NEP-deficient mice have elevated levels of Aβ dimers at 13 months. After Aβ IP with antibody R1282, Western blotting (WB) was performed with a mix of the C-terminal-specific antibodies 2G3 (Aβx-40) and 21F12 (Aβx-42), then stripped and reprobed with antibody 4G8 (Aβ 17–24) to confirm specificity. A: IP-Western on GuHCl brain extracts from JN+/+, JN−/−, APP−/−, and a transgenic mouse line (J20) expressing the same APP minigene that is in our experimental animals but at much higher levels. B: IP-Western on NP-40 brain extracts. The lower, dominant band is Aβ monomer, and the higher band seen only in JN−/− lanes is Aβ dimer.
Figure 5
Basal levels and half-life of hippocampal ISF Aβ are increased in NEP-deficient mice. Hippocampal ISF was assessed in awake, unrestrained 4.5-month-old JN+/+ and JN−/− mice via a microdialysis probe every hour for 12 hours and Aβ1-x measured by ELISA. A: Data points represent the mean ISF Aβ concentrations ± SEM at the specified times of five or six animals. After the first 4 hours, mice were injected subcutaneously with LY411575, a γ-secretase inhibitor, to prevent generation of new Aβ (denoted by dashed vertical line just after time point 0). B: Each data point denotes the mean Aβ concentration of the five ISF samples removed from a single mouse between time points −4 and 0 hours before administration of LY411575. The horizontal lines denote the mean basal ISF Aβ concentrations for each group (4.48 and 10.22 ng/ml for JN+/+and JN−/−, respectively; P = 0.001). C: ISF Aβ concentrations for samples collected from time points 0 to 5 hours were used to calculate the ISF Aβ half-life for each animal (closed circles) as described in Materials and Methods. The mean ISF Aβ half-life for each genotype group is designated by the horizontal line (1.7 and 2.1 hours for JN+/+and JN−/−, respectively; P = 0.01).
Similar articles
- Neprilysin deficiency alters the neuropathological and behavioral phenotype in the 5XFAD mouse model of Alzheimer's disease.
Hüttenrauch M, Baches S, Gerth J, Bayer TA, Weggen S, Wirths O. Hüttenrauch M, et al. J Alzheimers Dis. 2015;44(4):1291-302. doi: 10.3233/JAD-142463. J Alzheimers Dis. 2015. PMID: 25408216 - Reducing amyloid plaque burden via ex vivo gene delivery of an Abeta-degrading protease: a novel therapeutic approach to Alzheimer disease.
Hemming ML, Patterson M, Reske-Nielsen C, Lin L, Isacson O, Selkoe DJ. Hemming ML, et al. PLoS Med. 2007 Aug;4(8):e262. doi: 10.1371/journal.pmed.0040262. PLoS Med. 2007. PMID: 17760499 Free PMC article. - Neprilysin regulates amyloid Beta peptide levels.
Marr RA, Guan H, Rockenstein E, Kindy M, Gage FH, Verma I, Masliah E, Hersh LB. Marr RA, et al. J Mol Neurosci. 2004;22(1-2):5-11. doi: 10.1385/JMN:22:1-2:5. J Mol Neurosci. 2004. PMID: 14742905 - Aβ-degrading enzymes: potential for treatment of Alzheimer disease.
Miners JS, Barua N, Kehoe PG, Gill S, Love S. Miners JS, et al. J Neuropathol Exp Neurol. 2011 Nov;70(11):944-59. doi: 10.1097/NEN.0b013e3182345e46. J Neuropathol Exp Neurol. 2011. PMID: 22002425 Review. - Neprilysin inhibitors and risk of Alzheimer's disease: A future perspective.
Ali NH, Al-Kuraishy HM, Al-Gareeb AI, Alnaaim SA, Alexiou A, Papadakis M, Khalifa AA, Saad HM, Batiha GE. Ali NH, et al. J Cell Mol Med. 2024 Jan;28(2):e17993. doi: 10.1111/jcmm.17993. Epub 2023 Oct 17. J Cell Mol Med. 2024. PMID: 37847125 Free PMC article. Review.
Cited by
- Transthyretin and the brain re-visited: is neuronal synthesis of transthyretin protective in Alzheimer's disease?
Li X, Buxbaum JN. Li X, et al. Mol Neurodegener. 2011 Nov 23;6:79. doi: 10.1186/1750-1326-6-79. Mol Neurodegener. 2011. PMID: 22112803 Free PMC article. Review. - Proteolytic degradation of amyloid β-protein.
Saido T, Leissring MA. Saido T, et al. Cold Spring Harb Perspect Med. 2012 Jun;2(6):a006379. doi: 10.1101/cshperspect.a006379. Cold Spring Harb Perspect Med. 2012. PMID: 22675659 Free PMC article. Review. - Deletion of plasma Phospholipid Transfer Protein (PLTP) increases microglial phagocytosis and reduces cerebral amyloid-β deposition in the J20 mouse model of Alzheimer's disease.
Mansuy M, Baille S, Canet G, Borie A, Cohen-Solal C, Vignes M, Perrier V, Chevallier N, Le Guern N, Deckert V, Lagrost L, Givalois L, Desrumaux C. Mansuy M, et al. Oncotarget. 2018 Apr 13;9(28):19688-19703. doi: 10.18632/oncotarget.24802. eCollection 2018 Apr 13. Oncotarget. 2018. PMID: 29731975 Free PMC article. - The AbetaCs of Abeta-cleaving proteases.
Leissring MA. Leissring MA. J Biol Chem. 2008 Oct 31;283(44):29645-9. doi: 10.1074/jbc.R800022200. Epub 2008 Aug 22. J Biol Chem. 2008. PMID: 18723506 Free PMC article. Review. - Amyloid-β/Fyn-induced synaptic, network, and cognitive impairments depend on tau levels in multiple mouse models of Alzheimer's disease.
Roberson ED, Halabisky B, Yoo JW, Yao J, Chin J, Yan F, Wu T, Hamto P, Devidze N, Yu GQ, Palop JJ, Noebels JL, Mucke L. Roberson ED, et al. J Neurosci. 2011 Jan 12;31(2):700-11. doi: 10.1523/JNEUROSCI.4152-10.2011. J Neurosci. 2011. PMID: 21228179 Free PMC article.
References
- Walsh DM, Selkoe DJ. Deciphering the molecular basis of memory failure in Alzheimer’s disease. Neuron. 2004;44:181–193. - PubMed
- Cirrito JR, May PC, O’Dell MA, Taylor JW, Parsadanian M, Cramer JW, Audia JE, Nissen JS, Bales KR, Paul SM, DeMattos RB, Holtzman DM. In vivo assessment of brain interstitial fluid with microdialysis reveals plaque-associated changes in amyloid-beta metabolism and half-life. J Neurosci. 2003;23:8844–8853. - PMC - PubMed
- Iwata N, Tsubuki S, Takaki Y, Shirotani K, Lu B, Gerard NP, Gerard C, Hama E, Lee HJ, Saido TC. Metabolic regulation of brain Aβ by neprilysin. Science. 2001;292:1550–1552. - PubMed
Publication types
MeSH terms
Substances
Grants and funding
- R01 AG012749/AG/NIA NIH HHS/United States
- AG022476/AG/NIA NIH HHS/United States
- K23 AG022476/AG/NIA NIH HHS/United States
- R01 AG013956/AG/NIA NIH HHS/United States
- DA07261/DA/NIDA NIH HHS/United States
- AG13956/AG/NIA NIH HHS/United States
- NS046324/NS/NINDS NIH HHS/United States
- R37 AG013956/AG/NIA NIH HHS/United States
- AG12749/AG/NIA NIH HHS/United States
- T32 DA007261/DA/NIDA NIH HHS/United States
- K08 NS046324/NS/NINDS NIH HHS/United States
LinkOut - more resources
Full Text Sources
Other Literature Sources
Molecular Biology Databases


