The size of the nucleus increases as yeast cells grow - PubMed (original) (raw)
The size of the nucleus increases as yeast cells grow
Paul Jorgensen et al. Mol Biol Cell. 2007 Sep.
Abstract
It is not known how the volume of the cell nucleus is set, nor how the ratio of nuclear volume to cell volume (N/C) is determined. Here, we have measured the size of the nucleus in growing cells of the budding yeast Saccharomyces cerevisiae. Analysis of mutant yeast strains spanning a range of cell sizes revealed that the ratio of average nuclear volume to average cell volume was quite consistent, with nuclear volume being approximately 7% that of cell volume. At the single cell level, nuclear and cell size were strongly correlated in growing wild-type cells, as determined by three different microscopic approaches. Even in G1-phase, nuclear volume grew, although it did not grow quite as fast as overall cell volume. DNA content did not appear to have any immediate, direct influence on nuclear size, in that nuclear size did not increase sharply during S-phase. The maintenance of nuclear size did not require continuous growth or ribosome biogenesis, as starvation and rapamycin treatment had little immediate impact on nuclear size. Blocking the nuclear export of new ribosomal subunits, among other proteins and RNAs, with leptomycin B also had no obvious effect on nuclear size. Nuclear expansion must now be factored into conceptual and mathematical models of budding yeast growth and division. These results raise questions as to the unknown force(s) that expand the nucleus as yeast cells grow.
Figures
Figure 1.
Nuclear and nucleolar size is altered in yeast with abnormal cell size. Yeast cells bearing a CLN3-1 allele under the control of the GAL1 promoter were grown in media that generates very low CLN3 activity (top panels, glucose medium) or very high CLN3 activity (bottom panels, galactose medium). The cells expressed the nuclear envelope/ER marker Sec63CFP and the nucleolar marker Bud21YFP from the endogenous loci. All images are equally magnified; scale bar, 10 μm.
Figure 2.
Nuclear size correlates with cell size in different mutant backgrounds and nutrient conditions. (A) CLN3 affects nuclear size. Wild-type and cln3::GAL1pr-CLN3-1 strains expressing Sec63CFP were propagated to log phase in synthetic glucose (glu) or galactose (gal) medium, cross-sectional nuclear areas were measured from micrographs, and the distributions were plotted. (B and C) Representative cell volume and DNA content distributions of cultures in A. (D) whi mutants have small nuclei. Strains of the indicated genotype and expressing Sec63CFP were propagated in synthetic glucose medium to log phase, and the distribution of cross-sectional nuclear areas was determined. (E and F) Representative cell volume and DNA content distributions of cultures in D. (G) Carbon source influences nuclear size. Wild-type cells expressing Sec63CFP were measured as in A, but were propagated in glucose, galactose, or raffinose (raff) medium. (H and I) Representative cell volume and DNA content distributions of cultures in G. Live cell volume was measured with a Coulter particle analyzer. DNA content was measured by flow cytometry. Each nuclear size histogram is composed of 185–539 nuclei (see Table 2 for exact numbers). The Glu and Gal data for wild-type cells presented in A–C is the same data presented for Glu and Gal cells in G–I.
Figure 3.
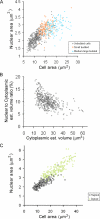
Nuclear size increases as cells grow. (A) Nuclear size correlates with cell size. Wild-type cells expressing Sec63CFP were propagated to log phase in synthetic raffinose medium and subjected to epifluorescence microscopy and morphometry. Nuclear and cell cross-sectional areas were plotted for unbudded cells (G1-phase, n = 454 cells, ◇), cells with small buds (S-phase, n = 132 cells, □), and cells with medium-to-large buds (late S/G2-phase, n = 108 cells, ▵). (B) The N/Cyt volume ratio decreases slightly as cells grow during G1-phase. Cross-sectional nuclear and cell areas of the unbudded cells from A were used to estimate nuclear and cell volume, assuming the nuclei and cells are spheres. Cytoplasmic volume was estimated to be the difference between cell and nuclear volume. Cells begin budding at ∼30 μm3 (data not shown). (C) Nuclear size correlates with cell size in both haploid (□, n = 207 cells) and diploid cells (○, n = 166 cells). Wild-type cells expressing Sec63CFP were propagated in synthetic glucose medium and imaged. Unlike A and B, each cell field was imaged as a small z-series and the maximal cross-sectional area for both the nucleus and the cell were determined before morphometry.
Figure 4.
Two independent microscopic methods confirm the correlation between cell and nuclear size. (A) Cells cultured in synthetic, 3% ethanol media and expressing a nuclear localized GFP were elutriated into different cell size fractions. Cells from a range of size fractions were imaged, and the cell and nuclear cross-sectional area measured. The nuclear boundary was defined by the edge of the green fluorescence, whereas the cell boundary was determined from a DIC image. ○, unbudded cells (G1-phase, n = 60 cells); ■, budded cells with a single nucleus (S/G2/M-phase, n = 17 cells). (B) The cell and nuclear areas of 17 cells in telophase plotted as horizontal bars. Telophase cells had two nuclei, one in the mother and one in the daughter cell. The proportion of the combined cell or nuclear cross-sectional area that is derived from the mother compartment (■) and the daughter compartment (□) is shown. (C) EM micrographs of representative G1-phase cells. The smaller cell was derived from elutriation of cells cultured in ethanol medium, and the larger cell was arrested by G1 cyclin depletion in glucose medium. (D) The cross-sectional area of the nucleus and the cell was determined from EM micrographs. Area is reported in arbitrary units. Fifty-seven cells from an elutriation in ethanol medium (black circles with gray interior), 12 cells from elutriation in glucose medium (■), and 16 cells from an arrest caused by G1 cyclin depletion (▵) were measured. All cells were in G1-phase.
Figure 5.
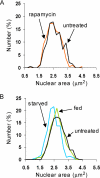
Blocking cell growth and repressing ribosome biogenesis does not strongly influence nuclear size. (A) Rapamycin treatment has no impact on nuclear size in the short-term. Wild type cells expressing Sec63CFP were propagated to log phase in synthetic glucose medium, treated with 0.2 μg/ml rapamycin, and visualized 36–60 min later. DMSO carrier had no effect on nuclear size (data not shown). Rapamycin, n = 220 cells; untreated, n = 196 cells. (B) Carbon starvation causes small decreases in nuclear size. Wild-type cells expressing Sec63CFP were propagated to log phase in synthetic glucose medium at 30°C. Aliquots of cells were then washed and resuspended in prewarmed 30°C synthetic medium with (fed) or without (starved) glucose. Starved cells were visualized 47–52 min after washing (n = 227 cells), and glucose-fed cells were visualized 54–58 min after washing (n = 244 cells). Untreated, n = 156 cells.
Figure 6.
Blocking Crm1-mediated nuclear export has no effect on nuclear size. Cells bearing SEC63-CFP and crm1(T539C) alleles were propagated to log phase in synthetic glucose medium, and an aliquot of culture was pelleted and imaged (0 min, black line, n = 43 cells). LMB was added to a final concentration of 100 ng/ml and aliquots of cells were pelleted and imaged 5 (blue line, n = 102 cells), 15 (green line, n = 153 cells), and 30 (red line, n = 115 cells) min later. Nuclear size was quantified for 43-153 cells at each time point. As in Figure 3C, each cell field was imaged as a small z-series and the maximal cross-sectional area for both the nucleus and the cell were determined before morphometry.
Similar articles
- Genetic analysis of the ribosome biogenesis factor Ltv1 of Saccharomyces cerevisiae.
Merwin JR, Bogar LB, Poggi SB, Fitch RM, Johnson AW, Lycan DE. Merwin JR, et al. Genetics. 2014 Nov;198(3):1071-85. doi: 10.1534/genetics.114.168294. Epub 2014 Sep 10. Genetics. 2014. PMID: 25213169 Free PMC article. - Factors affecting nuclear export of the 60S ribosomal subunit in vivo.
Stage-Zimmermann T, Schmidt U, Silver PA. Stage-Zimmermann T, et al. Mol Biol Cell. 2000 Nov;11(11):3777-89. doi: 10.1091/mbc.11.11.3777. Mol Biol Cell. 2000. PMID: 11071906 Free PMC article. - Nuclear export receptor Xpo1/Crm1 is physically and functionally linked to the spindle pole body in budding yeast.
Neuber A, Franke J, Wittstruck A, Schlenstedt G, Sommer T, Stade K. Neuber A, et al. Mol Cell Biol. 2008 Sep;28(17):5348-58. doi: 10.1128/MCB.02043-07. Epub 2008 Jun 23. Mol Cell Biol. 2008. PMID: 18573877 Free PMC article. - Nuclear export of ribosomal subunits.
Johnson AW, Lund E, Dahlberg J. Johnson AW, et al. Trends Biochem Sci. 2002 Nov;27(11):580-5. doi: 10.1016/s0968-0004(02)02208-9. Trends Biochem Sci. 2002. PMID: 12417134 Review. - CRM1 plays a nuclear role in transporting snoRNPs to nucleoli in higher eukaryotes.
Verheggen C, Bertrand E. Verheggen C, et al. Nucleus. 2012 Mar 1;3(2):132-7. doi: 10.4161/nucl.19266. Epub 2012 Mar 1. Nucleus. 2012. PMID: 22555597 Free PMC article. Review.
Cited by
- Mitochondrial network size scaling in budding yeast.
Rafelski SM, Viana MP, Zhang Y, Chan YH, Thorn KS, Yam P, Fung JC, Li H, Costa Lda F, Marshall WF. Rafelski SM, et al. Science. 2012 Nov 9;338(6108):822-4. doi: 10.1126/science.1225720. Science. 2012. PMID: 23139336 Free PMC article. - Roles of spatial parameters on the oscillation of nuclear NF-κB: computer simulations of a 3D spherical cell.
Ohshima D, Inoue J, Ichikawa K. Ohshima D, et al. PLoS One. 2012;7(10):e46911. doi: 10.1371/journal.pone.0046911. Epub 2012 Oct 3. PLoS One. 2012. PMID: 23056526 Free PMC article. - Characterization of cell-to-cell variation in nuclear transport rates and identification of its sources.
Durrieu L, Bush A, Grande A, Johansson R, Janzén D, Katz A, Cedersund G, Colman-Lerner A. Durrieu L, et al. iScience. 2022 Dec 29;26(1):105906. doi: 10.1016/j.isci.2022.105906. eCollection 2023 Jan 20. iScience. 2022. PMID: 36686393 Free PMC article. - A quantitative study of the Hog1 MAPK response to fluctuating osmotic stress in Saccharomyces cerevisiae.
Zi Z, Liebermeister W, Klipp E. Zi Z, et al. PLoS One. 2010 Mar 4;5(3):e9522. doi: 10.1371/journal.pone.0009522. PLoS One. 2010. PMID: 20209100 Free PMC article. - Nuclear size is regulated by importin α and Ntf2 in Xenopus.
Levy DL, Heald R. Levy DL, et al. Cell. 2010 Oct 15;143(2):288-98. doi: 10.1016/j.cell.2010.09.012. Cell. 2010. PMID: 20946986 Free PMC article.
References
- Brachmann C. B., Davies A., Cost G. J., Caputo E., Li J., Hieter P., Boeke J. D. Designer deletion strains derived from Saccharomyces cerevisiae S288C: a useful set of strains and plasmids for PCR-mediated gene disruption and other applications. Yeast. 1998;14:115–132. - PubMed
Publication types
MeSH terms
Substances
LinkOut - more resources
Full Text Sources
Other Literature Sources
Molecular Biology Databases


