Activation phenotype, rather than central- or effector-memory phenotype, predicts the recall efficacy of memory CD8+ T cells - PubMed (original) (raw)
Activation phenotype, rather than central- or effector-memory phenotype, predicts the recall efficacy of memory CD8+ T cells
Hirokazu Hikono et al. J Exp Med. 2007.
Abstract
The contributions of different subsets of memory CD8+ T cells to recall responses at mucosal sites of infection are poorly understood. Here, we analyzed the CD8+ T cell recall responses to respiratory virus infection in mice and demonstrate that activation markers, such as CD27 and CD43, define three distinct subpopulations of memory CD8+ T cells that differ in their capacities to mount recall responses. These subpopulations are distinct from effector- and central-memory subsets, coordinately express other markers associated with activation status, including CXCR3, CD127, and killer cell lectin-like receptor G1, and are superior to CD62L in predicting the capacity of memory T cells to mediate recall responses. Furthermore, the capacity of vaccines to elicit these memory T cell subpopulations predicted the efficacy of the recall response. These findings extend our understanding of how recall responses are generated and suggest that activation and migration markers define distinct, and unrelated, characteristics of memory T cells.
Figures
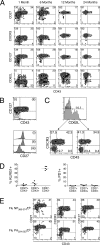
Figure 1.
Memory CD8+ T cells can be divided into three major subsets. (A) Splenocytes isolated at various times after infection were stained with Sendai NP324–332/Kb tetramer and monoclonal antibodies. The profiles are gated on tetramer+/CD8+ cells, and the numbers indicate the percentage of gated cells in each quadrant. Data are representative of six individual mice at 1 and 6 mo after infection, and three individual mice at 12 and 24 mo after infection. (B) Splenocytes isolated 1 mo after Sendai infection were stained as described in A and gated on tetramer+/CD8+cells. The top plot depicts the CD127 × CD43 profile of tetramer+ cells, and the roman numerals correspond to the expression of CD27 (shown in the histograms below) within the indicated quadrant. (C) Splenocytes isolated 1 mo after Sendai virus infection were stained as described for A and gated on tetramer+/CD8+ cells. CXCR3 × CD43 profiles were then determined on either CD62Llo or CD62Lhi cells. Data are from the same staining experiment as in A. (D) Splenocytes isolated 1 mo after Sendai virus infection were stained with NP324–332/Kb tetramer and monoclonal antibodies. Data show the percentage of KLRG1+ or PD1+ cells among tetramer+/CD8+ cells that had been subgated into CD27hi/CD43lo, CD27hi/CD43hi, and CD27lo/CD43lo subpopulations. (E) Splenocytes isolated 1 mo after intranasal x31 influenza virus infection were stained with either Flu NP366–374/Db tetramer or Flu PA224-233/Db tetramer and monoclonal antibodies as described in A. The data in each subpanel are gated on either Flu NP366–374/Db tetramer+/CD8+ cells (top) or Flu PA224–233/Db tetramer+/CD8+ cells (bottom), and the numbers represent the percentage of cells in each quadrant. The data are representative of three independent experiments.
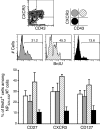
Figure 2.
Memory CD8+ T cell subpopulations homeostatically proliferate at different rates. Mice (1 mo after Sendai virus infection) were administered BrdU in the drinking water for 14 d. Splenocytes were then stained with Sendai NP324–332/Kb tetramer and monoclonal antibodies. The cells were gated first on tetramer+/CD8+ cells and then subgated into CXCR3hi/CD43lo, CXCR3hi/CD43hi, and CXCR3lo/CD43lo subpopulations (as indicated by the flow cytometric plot and schematic diagram, top panels). The frequency of BrdU+ cells was then determined in each subpopulation. The bar chart shows the percentage of BrdU+ cells in total tetramer+/CD8+ cells (pen bars) or in tetramer+/CD8+ cells gated on each of the memory T cell subpopulations based on either CD27×CD43 expression, CXCR3×CD43 expression, or CD127×CD43 expression (shaded bars use the same schematic indicated in the top right of the figure). The values are means ± SD of three individual mice and are representative of three independent experiments.
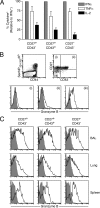
Figure 3.
Memory CD8+ T cell subpopulations display similar effector functions after antigen challenge. (A) Splenic memory CD8+ T cells from C57BL/6 mice were isolated 1 mo after infection and flow cytometrically sorted into subpopulations based on activation marker expression (CD27hi/CD43lo, CD27hi/CD43hi, and CD27lo/CD43lo). Aliquots of the sorted cells were stained with Sendai NP324–332/Kb tetramer to determine the frequency of antigen-specific cells within each subset. Sorted populations were co-cultured with CD45.1+ splenocytes pulsed with 1 μg Sendai NP324–332 peptide for 5 h in the presence of brefeldin A, and IFN-γ, TNF-α, and IL-2 were measured by intracellular staining and flow cytometry. The data are plotted as the frequency of cytokine+ cells and normalized to IFN-γ expression. The data are derived from three independent experiments for each subpopulation. (B) Splenocytes from resting Sendai memory mice were divided into memory CD8+ subpopulations by staining with Sendai NP324–332/Kb tetramer, CD27, and CD43 (top), and granzyme B expression was measured in each subpopulation as denoted by roman numerals (bottom). In each of the bottom panels, granzyme B expression is denoted by the open histogram, and isotype control staining is shown by the shaded histogram. The data are representative of two independent experiments. (C) Splenic memory CD8+ T cell subsets were isolated from C57BL/6 by cell sorting as described above, and the number of Sendai-specific cells within each subpopulation was determined by staining with Sendai NP324–332/Kb tetramer. 3,000–5,000 Sendai-specific cells from each subpopulation were transferred intravenously into individual naive CD90.1+ recipient mice, and the recipient mice were infected with 250 EID50 Sendai virus 24 h later. Bronchoalveolar lavage, lung parenchyma, and spleen were harvested 11 d after infection, and granzyme B expression was measured in Sendai-specific donor cells. The histograms shown are gated on Sendai NP324–332/Kb+ CD90.2+ donor cells, with granzyme B expression denoted by the open histogram and isotype control staining denoted by the shaded histogram. The phenotype of the sorted memory donor subpopulations transferred is listed at the top of each column. The data are representative of two independent experiments, with three recipient mice for each memory subset.
Figure 4.
Recall efficacy of CD43hi and CD43lo memory T cells. Donor mice (CD45.2/CD90.2 and CD45.1/CD90.2) were infected with Sendai virus and splenocytes isolated 1 mo later. Cells were enriched for CD8+ cells on negative selection columns and then sorted into CD44hi/CD43hi and CD44hi/CD43lo subpopulations by FACS. Sorted subsets were combined from each donor, such that the number of Sendai NP324–332/Kb+ cells derived from each donor was equivalent (usually 10,000 tetramer+ cells comprised of 5,000 cells from each donor) and intravenously transferred into recipient mice (CD45.2/CD90.1). 1 d after transfer, the recipient mice were then intranasally challenged with Sendai virus, and the indicated tissues were analyzed 11 d later. The flow cytometric profiles in the bottom rows of each panel are gated on tetramer+/CD8+ cells (indicated in the oval gate in the top panels). The data are representative from two recipient mice.
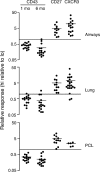
Figure 5.
Memory CD8+ T cell subpopulations differ in their capacity to mediate recall responses. Splenic CD8+ T cells were isolated at 1 mo after infection (and additionally at 6 mo after infection for CD43 only) and flow cytometrically sorted into CD43hi/lo, CD27hi/lo, or CXCR3hi/lo subpopulations. The cells were then tested for their capacity to contribute to a recall response to intranasal Sendai virus challenge using the strategy outlined in Fig. 4. The relative response in each tissue was calculated as the percentage of Sendai NP324–332/Kb-specific T cells derived from one donor population divided by the percentage from the second donor population (i.e., the ratio of donor cell populations recruited to the tissue). Each symbol represents data from an individual recipient mouse. Data are from four independent experiments for CD43 (1 and 6 mo after infection) and CD27 and six independent experiments for CXCR3. Pleural cavity lavages were not collected in all of the CXCR3 experiments.
Figure 6.
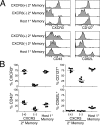
Activation marker phenotype is retained on secondary memory CD8+ T cells. Mice from the dual adoptive transfer of CXCR3+ and CXCR3− memory CD44+/CD8+ T cells in Fig. 5 were analyzed on day 34 after infection. Spleens were harvested, and the expression of CXCR3, CD127, CD43, and CD62L was analyzed on tetramer+/CD8+ gated cells from the host (1° memory) and each of the transferred populations (CXCR3+ 2° memory and CXCR3− 2° memory). Representative staining from one mouse is shown in A. (B) Cumulative data from independent transfer experiments. Each symbol represents an individual mouse. The data are representative of three independent experiments.
Figure 7.
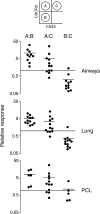
CD43lo/CXCR3hi memory CD8+ T cell subset mediates the strongest recall responses. Donor mice (CD45.2/CD90.2 and CD45.1/CD90.2) were infected with Sendai virus. 1 mo later, splenocytes were enriched for CD8+ cells using negative selection columns and flow cytometrically sorted into CD44hi/CD43lo/CXCR3hi (subpopulation A), CD44hi/CD43lo/CXCR3lo (subpopulation B), and CD44hi/CD43hi/CXCR3hi (subpopulation C) as illustrated in the schematic and using the strategy outlined in Fig. S1. Cells were then tested pair wise in dual adoptive transfer experiments for their capacity to contribute to a recall responses to intranasal Sendai virus challenge, as described in the legends to Figs. 4 and 5. Each symbol represents data from an individual recipient mouse, and the data are derived from four independent experiments.
Figure 8.
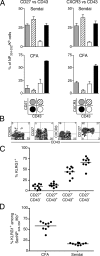
Memory CD8+ T cells generated by peptide/CFA vaccination are enriched for cells with a poorly proliferative phenotype. Mice were either intranasally infected with Sendai virus or subcutaneously vaccinated with Sendai NP324–332 peptide/CFA and analyzed 1 mo later. (A) Phenotype of tetramer+/CD8+ cells based on the expression of CD27 and CD43 (left) or CXCR3 and CD43 (right) in Sendai virus–immune mice (top panels) or peptide/CFA-vaccinated mice (bottom panels). Each subpopulation is indicated by the shading pattern in the schematic under the bar charts. The data show the means ± SD of three individual mice. (B) Coexpression of CD43, CD62L, CD27, CXCR3, and CD127 on tetramer+/CD8+ gated cells from NP324–332/CFA-vaccinated mice 1 mo after vaccination. Numbers represent the percentage of cells in each quadrant. The data are representative of three individual mice. (C) Splenocytes from peptide/CFA-vaccinated mice were gated on tetramer+/CD8+ cells and divided into subsets based on the expression of CD27 and CD43. The frequency of KLRG1+ cells within each subset is plotted for individual mice. (D) The frequency of KLRG1+ cells among total Sendai NP324–332/Kb+ cells after peptide/CFA vaccination or Sendai virus infection are plotted for individual mice. The data for C and D are combined from two independent experiments.
Figure 9.
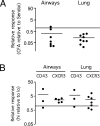
Memory CD8+ T cells generated by peptide/CFA vaccination exhibit poor recall efficacy. (A) Recall efficacy of memory CD8+ T cells generated by Sendai virus infection and peptide/CFA vaccination. C57BL/6 donor mice were subcutaneously vaccinated with Sendai virus nucleoprotein peptide (NP324–332) emulsified in CFA, and CD90.1 donor mice were intranasally infected with Sendai virus. 1 mo later, splenic CD8+/CD44hi memory cells were isolated and analyzed in dual adoptive transfer experiments for their capacity to contribute to recall responses to intranasal Sendai virus challenge, as described in the legend to Figs. 4 and 5. Each symbol represents data from an individual recipient mouse, and the data are derived from three independent experiments. (B) Comparison of the relative responses of memory CD8+ T cell subpopulations elicited by peptide/CFA vaccination. Mice were vaccinated or infected as described for A, and CD8+ enriched cells were sorted into CD44hi/CD43hi and CD44hi/CD43lo (or CD44hi/CXCR3hi and CD44hi/CXCR3lo) by FACS. The sorted subsets were then compared by dual adoptive transfer as described for A. Each symbol represents data from an individual recipient mouse, and two independent experiments were performed for CD43 and CXCR3.
Similar articles
- T-cell memory and recall responses to respiratory virus infections.
Hikono H, Kohlmeier JE, Ely KH, Scott I, Roberts AD, Blackman MA, Woodland DL. Hikono H, et al. Immunol Rev. 2006 Jun;211:119-32. doi: 10.1111/j.0105-2896.2006.00385.x. Immunol Rev. 2006. PMID: 16824122 Review. - Differential contributions of central and effector memory T cells to recall responses.
Roberts AD, Ely KH, Woodland DL. Roberts AD, et al. J Exp Med. 2005 Jul 4;202(1):123-33. doi: 10.1084/jem.20050137. Epub 2005 Jun 27. J Exp Med. 2005. PMID: 15983064 Free PMC article. - Contribution of pulmonary KLRG1(high) and KLRG1(low) CD8 T cells to effector and memory responses during influenza virus infection.
Ye F, Turner J, Flaño E. Ye F, et al. J Immunol. 2012 Dec 1;189(11):5206-11. doi: 10.4049/jimmunol.1200137. Epub 2012 Oct 22. J Immunol. 2012. PMID: 23089397 Free PMC article. - Persistent Antigen and Prolonged AKT-mTORC1 Activation Underlie Memory CD8 T Cell Impairment in the Absence of CD4 T Cells.
Li Y, Shen C, Zhu B, Shi F, Eisen HN, Chen J. Li Y, et al. J Immunol. 2015 Aug 15;195(4):1591-8. doi: 10.4049/jimmunol.1500451. Epub 2015 Jul 10. J Immunol. 2015. PMID: 26163589 Free PMC article. - Are CD8+CD122+ cells regulatory T cells or memory T cells?
Suzuki H, Shi Z, Okuno Y, Isobe K. Suzuki H, et al. Hum Immunol. 2008 Nov;69(11):751-4. doi: 10.1016/j.humimm.2008.08.285. Epub 2008 Sep 24. Hum Immunol. 2008. PMID: 18817826 Review.
Cited by
- BRD7 as key factor in PBAF complex assembly and CD8+ T cell differentiation.
Huang F, Lin Y, Qiao Y, Yuan Y, Zhong Z, Luo B, Wu Y, Liu J, Chen J, Zhang W, Zhang H, Liu B. Huang F, et al. JCI Insight. 2024 Jul 2;9(15):e171605. doi: 10.1172/jci.insight.171605. JCI Insight. 2024. PMID: 38954484 Free PMC article. - Late-rising CD4 T cells resolve mouse cytomegalovirus persistent replication in the salivary gland.
Brunel S, Picarda G, Gupta A, Ghosh R, McDonald B, El Morabiti R, Jiang W, Greenbaum JA, Adler B, Seumois G, Croft M, Vijayanand P, Benedict CA. Brunel S, et al. PLoS Pathog. 2024 Jan 18;20(1):e1011852. doi: 10.1371/journal.ppat.1011852. eCollection 2024 Jan. PLoS Pathog. 2024. PMID: 38236791 Free PMC article. - CD8 T cells recruited early in mouse polyomavirus infection undergo exhaustion.
Wilson JJ, Pack CD, Lin E, Frost EL, Albrecht JA, Hadley A, Hofstetter AR, Tevethia SS, Schell TD, Lukacher AE. Wilson JJ, et al. J Immunol. 2012 May 1;188(9):4340-8. doi: 10.4049/jimmunol.1103727. Epub 2012 Mar 23. J Immunol. 2012. PMID: 22447978 Free PMC article. - Tumor necrosis factor receptor/tumor necrosis factor family members in antiviral CD8 T-cell immunity.
Salek-Ardakani S, Croft M. Salek-Ardakani S, et al. J Interferon Cytokine Res. 2010 Apr;30(4):205-18. doi: 10.1089/jir.2010.0026. J Interferon Cytokine Res. 2010. PMID: 20377415 Free PMC article. Review. - Limiting the amount and duration of antigen exposure during priming increases memory T cell requirement for costimulation during recall.
Floyd TL, Koehn BH, Kitchens WH, Robertson JM, Cheeseman JA, Stempora L, Larsen CP, Ford ML. Floyd TL, et al. J Immunol. 2011 Feb 15;186(4):2033-41. doi: 10.4049/jimmunol.1003015. Epub 2011 Jan 21. J Immunol. 2011. PMID: 21257960 Free PMC article.
References
- Seder, R.A., and R. Ahmed. 2003. Similarities and differences in CD4+ and CD8+ effector and memory T cell generation. Nat. Immunol. 4:835–842. - PubMed
- Hogan, R.J., E.J. Usherwood, W. Zhong, A.D. Roberts, R.W. Dutton, A.G. Harmsen, and D.L. Woodland. 2001. Activated antigen-specific CD8+ T cells persist in the lungs following recovery from respiratory virus infections. J. Immunol. 166:1813–1822. - PubMed
- Wiley, J.A., R.J. Hogan, D.L. Woodland, and A.G. Harmsen. 2001. Antigen-specific CD8+ T cells persist in the upper respiratory tract following influenza virus infection. J. Immunol. 167:3293–3299. - PubMed
Publication types
MeSH terms
Substances
Grants and funding
- HL 63925/HL/NHLBI NIH HHS/United States
- F32 AI058668/AI/NIAID NIH HHS/United States
- AI 055500/AI/NIAID NIH HHS/United States
- AG 021600/AG/NIA NIH HHS/United States
- AI 58668/AI/NIAID NIH HHS/United States
- R01 AI055500/AI/NIAID NIH HHS/United States
- P01 AG021600/AG/NIA NIH HHS/United States
- P01 HL063925/HL/NHLBI NIH HHS/United States
LinkOut - more resources
Full Text Sources
Other Literature Sources
Research Materials
