Autophagy mitigates metabolic stress and genome damage in mammary tumorigenesis - PubMed (original) (raw)
Autophagy mitigates metabolic stress and genome damage in mammary tumorigenesis
Vassiliki Karantza-Wadsworth et al. Genes Dev. 2007.
Abstract
Autophagy is a catabolic process involving self-digestion of cellular organelles during starvation as a means of cell survival; however, if it proceeds to completion, autophagy can lead to cell death. Autophagy is also a haploinsufficient tumor suppressor mechanism for mammary tumorigenesis, as the essential autophagy regulator beclin1 is monoallelically deleted in breast carcinomas. However, the mechanism by which autophagy suppresses breast cancer remains elusive. Here we show that allelic loss of beclin1 and defective autophagy sensitized mammary epithelial cells to metabolic stress and accelerated lumen formation in mammary acini. Autophagy defects also activated the DNA damage response in vitro and in mammary tumors in vivo, promoted gene amplification, and synergized with defective apoptosis to promote mammary tumorigenesis. Therefore, we propose that autophagy limits metabolic stress to protect the genome, and that defective autophagy increases DNA damage and genomic instability that ultimately facilitate breast cancer progression.
Figures
Figure 1.
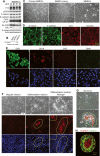
MMEC model. (A) Western blot analysis of E1A, p53DD, β-catenin, E-cadherin, CK8/18, Ep-CAM, ERα, β-casein, and actin in independently derived wild-type iMMEC cell lines (WTA-D) in regular growth medium. (B) Western blot analysis of β-casein and actin in iBMKs, immortalized mouse prostate epithelial cells (iMPECs), and iMMECs (WTA) in regular growth medium. (C) Phase contrast. (D) IF of WTA cells for tight junction proteins. (E) IF of WTA cells for luminal (CK8) and basal/myoepithelial (CK14, CK5, SMA) markers. (F) Lactogenic stimulation of WTA cells. (Top panel) Phase contrast. (Middle panel) β-casein IF counterstain. (Bottom panel) DAPI counterstain. (G) Red oil O staining. (H) Confocal cross-section through the center of WTA acinus grown for 12 d in regular 3D morphogenesis medium, stimulated for 2 d with lactogenic hormones, and immunostained with β-casein (red) and β-catenin (green). Domes formed upon lactogenic stimulation of WTA cells are encircled by a yellow line in F and G.
Figure 2.
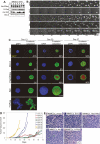
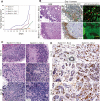
MMEC model. (A) Western blots showing protein expression in iMMEC WTA-derived cell lines stably expressing vector control (V), wild-type HER2/neu (lanes 1–7), H-RasV12 (lanes 1–7), _myr_-Akt (lanes 1–7), and Bcl-2 (lanes 1–7). (B) Seven-day time course of 3D morphogenesis captured by time-lapse videos of mammary acini generated by WTA-derived cell lines expressing vector (WTA.V), Bcl-2 (WTA.B1), HER2/neu (WTA.H2), Akt (WTA.A5), and H-Ras (WTA.R3) cultured in Matrigel. (C) IF of mammary acini generated by the cell lines mentioned in B. Images are confocal cross-sections through the center of acini immunostained with β-catenin (green) and activated caspase-3 (red); nuclei were counterstained with DAPI (blue). Images are representative of the majority of acini for a specific genotype at a given time point, and the number at the bottom right corner of each frame is the percentage of acini with lumen formation. (D) Tumor growth kinetics of WTA-derived iMMEC cell lines. (E) H&E staining of tumors generated by the cell lines shown in B.
Figure 3.
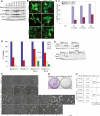
beclin1 heterozygocity impairs autophagy and increases susceptibility of mammary epithelial cells to metabolic stress in vitro. (A) Western blot analysis of Beclin1, E1A, p53DD, Bcl-2, and actin in beclin1+/+ and beclin1+/− iMMEC cell lines. (B) Fluorescence of beclin1+/+ and beclin1+/− iMMECs with Bcl-2 (WT3.B3, BLN2.B4) and stably expressing EGFP-LC3 after 0, 24, and 48 h of metabolic stress. (C) Quantitation of autophagy (percentage EGFP-LC3 translocation) in WT3.B3 and BLN2.B4 stably expressing EGFP-LC3 following 0, 1, 2, and 3 d of metabolic stress. Three independent experiments were performed, and the mean values with standard deviation are presented. (D) Viability of beclin1+/+ and beclin1+/− iMMECs without and with Bcl-2 following 0, 1, 3, and 5 d of metabolic stress. Four independent cell lines per genotype were examined, and the mean values with standard deviation are presented. (E) Western blot analysis of activated caspase-3 in beclin1+/+ and beclin1+/− iMMECs without (WT3, BLN2) and with (WT3.B3, BLN2.B4) Bcl-2 in response to metabolic stress in vitro. (F) Identical frames from 2- to 5-d time-lapse videos of beclin1+/+ and beclin1+/− iMMEC cell lines without (WT3, BLN2) and with (WT3.B3, BLN2.B8) Bcl-2 under metabolic stress. (G,H) Clonogenic survival of beclin1+/+ and beclin1+/− iMMECs expressing Bcl-2 after exposure to metabolic stress for 12 d. (G) Representative plates (WT3.B3, BLN2.8). (H) Quantitation of clonogenic survival with standard deviation (SD). _P_-values were calculated by unpaired _t_-test and are provided for statistically significant results only.
Figure 4.
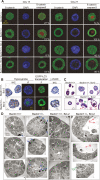
In 3D morphogenesis assays, allelic loss of beclin1 accelerates the death of central acinar cells, where metabolic stress and autophagy localize, and is associated with DNA damage response activation. (A) IF of mammary acini generated by beclin1+/+ and beclin1+/− iMMEC cell lines without (WT3, BLN2) and with Bcl-2 (WT3.B3, BLN2.B8) cultured in Matrigel. Acini were immunostained with β-catenin (green) and activated caspase-3 (red); nuclei were counterstained with DAPI (blue). Faint red color in lumens of acini formed by Bcl-2-expressing iMMECs represents background levels of activated caspase-3 staining. Images are representative of the majority of acini for a specific genotype at a given time point, and the number at the bottom right corner of each frame represents the percentage of acini with lumen formation. (B) Hypoxyprobe IHC and IF (green for hypoxyprobe, blue for nuclei) on acini formed by WT3.B3 and BLN2.B8 cells. Fluorescence (F) by confocal microscopy of acini formed by beclin1+/+ and beclin1+/− iMMECs with Bcl-2 (WT3.B3, BLN2.B8) and stably expressing EGFP-LC3. γ-H2AX IHC on acini formed by WT3.B3 and BLN2.B4 cells. (C,D) H&E (C) and electron microscopy (D) on acini formed by beclin1+/+ and beclin1+/− iMMECs without (WT3, BLN2) and with (WT3.B3, BLN2.B8) Bcl-2. (N) Necrotic cell; (TGC) aneuploid tumor giant cell; (L) lumen.
Figure 5.
Allelic loss of beclin1 promotes mammary tumorigenesis and activation of the DNA damage response in tumors in vivo. (A) Tumor growth kinetics of beclin1+/+ and beclin1+/− iMMEC cell lines without and with Bcl-2. (B) Autophagy in tumors localizes to regions of metabolic stress. H&E (left column) and hypoxyprobe IHC (middle column) on day 1 tumors generated by beclin1+/+ and beclin1+/− iMMECs with Bcl-2 (WT3.B3, BLN2.B8). EGFP-LC3 membrane translocation was monitored with EGFP-LC3 fluorescence by confocal microscopy on day 1 tumors generated by beclin1+/+ and beclin1+/− iMMECs with Bcl-2 (WT3.B3, BLN2.B8) and stably expressing EGFP-LC3; the areas presented (right column) are within the hypoxyprobe-staining regions between the rim of healthy cells and the necrotic centers. (C,D) Tumors derived from beclin1+/+ and beclin1+/− iMMECs with Bcl-2 (WT3.B3, BLN2.B8) were excised at days 15, 22, and 36 post-orthotopic implantation, and were compared by H&E staining (C) and by γ-H2AX IHC (D). Insert in top left panel of D represents a normal mammary gland.
Figure 6.
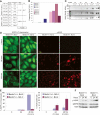
Allelic loss of beclin1 promotes drug resistance mediated by gene amplification in vitro. (A,B) Quantitation with standard deviation (SD) of PALA-resistance for beclin1+/+ and beclin1+/− iMMECs with Bcl-2 treated with PALA at 5× LD50. The _P_-value was calculated by unpaired _t_-test. (C) PCR of genomic DNA from several stable cell lines derived from independent PALAR colonies using primers for an 800-bp fragment of the CAD gene. (D) beclin1+/+ and beclin1+/− iMMECs with Bcl-2 (WT3.B3, BLN2.B4) and stably expressing EGFP-LC3 after 0, 24, and 48 h of PALA treatment at LD50. (Left panel) Fluorescence (F). (Right panel) γ-H2AX IF. (E) WT3.B3 and BLN2.B4 stably expressing EGFP-LC3 following 0, 24, and 48 h of PALA treatment at LD50. (Left panel) Quantitation of autophagy (percentage EGFP-LC3 translocation). (Right panel) Quantitation of γ-H2AX activation (percentage γ-H2AX-positive cells as number of cells with bright red nuclei/total number of cells). Three independent experiments were performed, and the mean values with standard deviation are presented. _P_-values were calculated by unpaired _t_-test. (F) Western blot analysis of γ-H2AX, GRP-78, and actin in WT3.B3 and BLN2.B4 stably expressing EGFP-LC3 following 0, 24, and 48 h of PALA treatment at LD50.
Similar articles
- Role of autophagy in breast cancer.
Karantza-Wadsworth V, White E. Karantza-Wadsworth V, et al. Autophagy. 2007 Nov-Dec;3(6):610-3. doi: 10.4161/auto.4867. Epub 2007 Aug 14. Autophagy. 2007. PMID: 17786023 Free PMC article. - Autophagy suppresses tumor progression by limiting chromosomal instability.
Mathew R, Kongara S, Beaudoin B, Karp CM, Bray K, Degenhardt K, Chen G, Jin S, White E. Mathew R, et al. Genes Dev. 2007 Jun 1;21(11):1367-81. doi: 10.1101/gad.1545107. Epub 2007 May 17. Genes Dev. 2007. PMID: 17510285 Free PMC article. - ERBB2 overexpression suppresses stress-induced autophagy and renders ERBB2-induced mammary tumorigenesis independent of monoallelic Becn1 loss.
Lozy F, Cai-McRae X, Teplova I, Price S, Reddy A, Bhanot G, Ganesan S, Vazquez A, Karantza V. Lozy F, et al. Autophagy. 2014 Apr;10(4):662-76. doi: 10.4161/auto.27867. Epub 2014 Jan 30. Autophagy. 2014. PMID: 24492513 Free PMC article. - Role and regulation of autophagy in cancer.
Chen N, Karantza-Wadsworth V. Chen N, et al. Biochim Biophys Acta. 2009 Sep;1793(9):1516-23. doi: 10.1016/j.bbamcr.2008.12.013. Epub 2009 Jan 2. Biochim Biophys Acta. 2009. PMID: 19167434 Free PMC article. Review. - Role of autophagy in cancer: management of metabolic stress.
Jin S, White E. Jin S, et al. Autophagy. 2007 Jan-Feb;3(1):28-31. doi: 10.4161/auto.3269. Epub 2007 Jan 3. Autophagy. 2007. PMID: 16969128 Free PMC article. Review.
Cited by
- Autophagy confers DNA damage repair pathways to protect the hematopoietic system from nuclear radiation injury.
Lin W, Yuan N, Wang Z, Cao Y, Fang Y, Li X, Xu F, Song L, Wang J, Zhang H, Yan L, Xu L, Zhang X, Zhang S, Wang J. Lin W, et al. Sci Rep. 2015 Jul 21;5:12362. doi: 10.1038/srep12362. Sci Rep. 2015. PMID: 26197097 Free PMC article. - The Role of Ras-Associated Protein 1 (Rap1) in Cancer: Bad Actor or Good Player?
Looi CK, Hii LW, Ngai SC, Leong CO, Mai CW. Looi CK, et al. Biomedicines. 2020 Sep 7;8(9):334. doi: 10.3390/biomedicines8090334. Biomedicines. 2020. PMID: 32906721 Free PMC article. Review. - Recent insights into the function of autophagy in cancer.
Amaravadi R, Kimmelman AC, White E. Amaravadi R, et al. Genes Dev. 2016 Sep 1;30(17):1913-30. doi: 10.1101/gad.287524.116. Genes Dev. 2016. PMID: 27664235 Free PMC article. Review. - Cyclin D1 activity regulates autophagy and senescence in the mammary epithelium.
Brown NE, Jeselsohn R, Bihani T, Hu MG, Foltopoulou P, Kuperwasser C, Hinds PW. Brown NE, et al. Cancer Res. 2012 Dec 15;72(24):6477-89. doi: 10.1158/0008-5472.CAN-11-4139. Epub 2012 Oct 4. Cancer Res. 2012. PMID: 23041550 Free PMC article. - Crosstalk between autophagy and immune cell infiltration in the tumor microenvironment.
Yang T, Zhang Y, Chen J, Sun L. Yang T, et al. Front Med (Lausanne). 2023 Feb 6;10:1125692. doi: 10.3389/fmed.2023.1125692. eCollection 2023. Front Med (Lausanne). 2023. PMID: 36814780 Free PMC article. Review.
References
- Abedin M.J., Wang D., McDonnell M.A., Lehmann U., Kelekar A., Wang D., McDonnell M.A., Lehmann U., Kelekar A., McDonnell M.A., Lehmann U., Kelekar A., Lehmann U., Kelekar A., Kelekar A. Autophagy delays apoptotic death in breast cancer cells following DNA damage. Cell Death Differ. 2007;14:500–510. - PubMed
- Aita V.M., Liang X.H., Murty V.V., Pincus D.L., Yu W., Cayanis E., Kalachikov S., Gilliam T.C., Levine B., Liang X.H., Murty V.V., Pincus D.L., Yu W., Cayanis E., Kalachikov S., Gilliam T.C., Levine B., Murty V.V., Pincus D.L., Yu W., Cayanis E., Kalachikov S., Gilliam T.C., Levine B., Pincus D.L., Yu W., Cayanis E., Kalachikov S., Gilliam T.C., Levine B., Yu W., Cayanis E., Kalachikov S., Gilliam T.C., Levine B., Cayanis E., Kalachikov S., Gilliam T.C., Levine B., Kalachikov S., Gilliam T.C., Levine B., Gilliam T.C., Levine B., Levine B. Cloning and genomic organization of beclin 1, a candidate tumor suppressor gene on chromosome 17q21. Genomics. 1999;59:59–65. - PubMed
- Albertson D.G. Gene amplification in cancer. Trends Genet. 2006;22:447–455. - PubMed
- Albertson D.G., Collins C., McCormick F., Gray J.W., Collins C., McCormick F., Gray J.W., McCormick F., Gray J.W., Gray J.W. Chromosome aberrations in solid tumors. Nat. Genet. 2003;34:369–376. - PubMed
- Al-Kuraya K., Schraml P., Torhorst J., Tapia C., Zaharieva B., Novotny H., Spichtin H., Maurer R., Mirlacher M., Kochli O., Schraml P., Torhorst J., Tapia C., Zaharieva B., Novotny H., Spichtin H., Maurer R., Mirlacher M., Kochli O., Torhorst J., Tapia C., Zaharieva B., Novotny H., Spichtin H., Maurer R., Mirlacher M., Kochli O., Tapia C., Zaharieva B., Novotny H., Spichtin H., Maurer R., Mirlacher M., Kochli O., Zaharieva B., Novotny H., Spichtin H., Maurer R., Mirlacher M., Kochli O., Novotny H., Spichtin H., Maurer R., Mirlacher M., Kochli O., Spichtin H., Maurer R., Mirlacher M., Kochli O., Maurer R., Mirlacher M., Kochli O., Mirlacher M., Kochli O., Kochli O., et al. Prognostic relevance of gene amplifications and coamplifications in breast cancer. Cancer Res. 2004;64:8534–8540. - PubMed
Publication types
MeSH terms
Substances
LinkOut - more resources
Full Text Sources
Other Literature Sources
Molecular Biology Databases
Research Materials
