Locally controlled inhibitory mechanisms are involved in eukaryotic GPCR-mediated chemosensing - PubMed (original) (raw)
Locally controlled inhibitory mechanisms are involved in eukaryotic GPCR-mediated chemosensing
Xuehua Xu et al. J Cell Biol. 2007.
Abstract
Gprotein-coupled receptor (GPCR) signaling mediates a balance of excitatory and inhibitory activities that regulate Dictyostelium chemosensing to cAMP. The molecular nature and kinetics of these inhibitors are unknown. We report that transient cAMP stimulations induce PIP3 responses without a refractory period, suggesting that GPCR-mediated inhibition accumulates and decays slowly. Moreover, exposure to cAMP gradients leads to asymmetric distribution of the inhibitory components. The gradients induce a stable accumulation of the PIP3 reporter PHCrac-GFP in the front of cells near the cAMP source. Rapid withdrawal of the gradient led to the reassociation of G protein subunits, and the return of the PIP3 phosphatase PTEN and PHCrac-GFP to their pre-stimulus distribution. Reapplication of cAMP stimulation produces a clear PHCrac-GFP translocation to the back but not to the front, indicating that a stronger inhibition is maintained in the front of a polarized cell. Our study demonstrates a novel spatiotemporal feature of currently unknown inhibitory mechanisms acting locally on the PI3K activation pathway.
Figures
Figure 1.
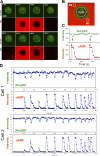
Transient cAMP stimuli induce repetitive transient PIP3 responses visualized by the PHCrac-GFP membrane translocation. (A) Transient cAMP stimulations (red channel) trigger membrane translocations of PHCrac-GFP (green channel) in a living cell. Images were captured at 4-s intervals, and the frames at selected time points are shown here. (B) Temporal changes in cAMP concentration around the cell were measured as the average of fluorescence intensity of Alexa 594 in the regions of R1 and R2. PHCrac-GFP translocation was quantified as the intensity decreases of GFP in the cytoplasm (cyto) of the cell. (C) Dynamic changes in cAMP concentration around the cell (red) and in levels of PHCrac-GFP in cytosol (green) are shown for the selected time period shown in A. (D) Temporal changes in relative levels of PHCrac-GFP in cytosol are shown in the time course for the entire experiment. Temporal changes in the intensity of Alexa 594 were measured in R1 (the front region) and R2 (the back region), which were almost identical in each short pulse under our experimental conditions. Temporal changes in cAMP concentration around the cell are shown as the average fluorescence intensity in R1 and R2 in the time course. The results for two cells are shown.
Figure 2.
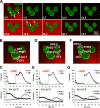
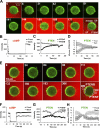
After a withdrawal of a cAMP gradient from a “polarized” cell, the original front of the cell is temporally less responsive to cAMP stimulation. (A) Cells expressing PHCrac-GFP (green) were polarized in a cAMP (red) gradient (1 μM cAMP mixed with Alexa594, red) at 0 s (arrows at 0 s point to the fronts). After a withdrawal of the cAMP gradient at 0 s, a uniform cAMP simulation (100 nM of cAMP mixed with Alexa 594) induced PHCrac-GFP translocation to the back (arrows at 35 s) of the cells. An animated version is in the supplemental materials (Video 1, available at
http://www.jcb.org/cgi/content/full/jcb.200611096/DC1
). Another example is shown as Fig. S1 and Video 2. (B, D, and F). Regions of interest used for assessing concentration changes of cAMP with time in the front (DF1-3) and back (DB1-3), and for quantitative measurement of PHCrac-GFP dynamic changes for the selected front (PHF 1–3) and back (PHB 1–3) membrane regions for each of the three cells shown in A. (C, E, and G) Top panels show temporal changes of Alexa 594 fluorescence for cAMP concentration in the time course in the front (DF) and back (DB) regions. Bottom panels show temporal changes in relative levels of PHCrac-GFP in the front (PHF) and back (PHB) for each of the three cells.
Figure 3.
Single-cell FRET measurement of kinetics of G protein dissociation (activation), association (inactivation) and redissociation (reactivation), and temporal relationship between G protein reactivation and the inverted PHCrac-GFP translocation. (A) Cells expressing Gα2-CFP and YFP-Gβ (G cells) were suddenly exposed to cAMP field (10 μM) at 0 s. The cAMP field was suddenly removed at 42 s and reapplied at 93 s. Fluorescence images of CFP and YFP of a G cell at resting or fully activated stages. (B) Temporal changes in G protein activation at the cell membrane. A normalized FRET change (expressed as CFP/YFP ratio) indicates relative level of G protein activation at the cell membrane. Kinetics of cAMP mediated changes in the FRET ratio in the entire membrane of single G cells are shown as means ± SD (n = 7). The thick gray bars show temporal changes in cAMP concentration. The thin black dashed line shows the basal level of FRET, which is 1. (C) The spatiotemporal relationship of G protein activation and the inverted PHCrac-GFP response. cAMP-mediated G protein activation was measured in the front and back regions of a G cell, and cAMP-induced PIP3 changes were monitored by PHCrac-GFP dynamics in the front and back of a nearby (within 20 μm) PH cell. A cAMP gradient (1 μM cAMP released from a micropipette) was suddenly withdrawn from the G and PH cells at 0 s. A uniform cAMP field (100 nM), applied at 134 s, induces a clear PHCrac-GFP translocation to the back of the PH cell. An animated version is in Video 2 (available at
http://www.jcb.org/cgi/content/full/jcb.200611096/DC1
). Regions of interest for simultaneous measurement of G protein activation in one G cell and the inverted PIP3 response in a PH cell are shown. (D) Selected images show the inverted PHCrac-GFP translocation in the experiment shown in C. The arrows point to direction of PHCrac-GFP membrane translocation: the original at 0 s and the inverted at 171 s. (E) The temporal changes in the G protein dissociation in the front (black) and back (gray) of the G cell, reflected as CFP intensity changes, in response to the uniform cAMP field. The basal level of G protein activation is 1, shown as the thin line. The thick gray bar indicates the temporal changes in cAMP concentration. (F) Temporal changes in PHCrac-GFP in the front and back of the PH cell in response to the uniform cAMP stimulation applied at 134 s. The basal levels of PHCrac-GFP in the front and back are 1, indicated as the thin dashed line. The thick gray bar indicates the temporal changes in cAMP concentration. (G) After a withdrawal of a gradient, a new uniformly applied cAMP field induced similar levels of G protein dissociation in the front and back of G cells, but triggered a clear PHCrac-GFP translocation only to the back regions of PH cells. Normalized maximal FRET changes and PHCrac-GFP increases in the front and back of G and PH cells are shown as means ± SD (n = 5). Basal levels are 1, indicated as dashed line.
Figure 4.
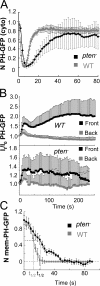
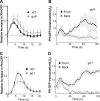
Dynamics of PHCrac-GFP membrane translocation in PTEN null cells upon a uniform and a gradient of cAMP stimulations. (A) WT and pten − cells expressing PHCrac-GFP were uniformly stimulated with cAMP (1 μM). Kinetics of PHCrac-GFP membrane translocation are shown as the normalized intensity changes in cytosolic PHCrac-GFP, where the intensity at time 0 is defined as 1 and the minimal intensity is defined as 0. (B) WT (top panel, as a control) and pten − cells expressing PHCrac-GFP were suddenly exposed to a cAMP gradient. Temporal changes in relative levels of PHCrac-GFP in the front and back of the cells. Means ± SD (n = 8) are shown. (C) Kinetics of membrane-bound PHCrac-GFP in the front of WT, as a control, and pten − cells in response to a withdrawal of an applied cAMP stimulation. Means ± SD (n = 10) are shown.
Figure 5.
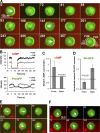
Spatiotemporal dynamics of PTEN in single cells upon a withdrawal of a cAMP gradient and then stimulated with a uniform dose (A–D) or a gradient (E–H) of cAMP. (A). A PTEN-GFP expressing cell was highly polarized in a stable cAMP gradient (red, 1 μM in the micropipette, red) at 0 s. The gradient was suddenly withdrawn from the cell at 0 s. A uniform cAMP stimulation (100 nM) was applied at 144 s. Regions of interest for the data reported in B and C are also shown. (B) Temporal changes in cAMP concentrations in the front (black) and back (gray) are shown in the time course. (C) Temporal changes in relative levels of membrane-bound PTEN in the front (black) and back (gray) regions are shown in the time course. (D) Kinetics of membrane-bound PTEN in the front and back are shown as means ± SD (n = 10) in response to a withdrawal and then to a uniformly applied stimulation. (E) A PTEN-GFP expressing cell was highly polarized in a stable cAMP gradient (red, 1 μM in the micropipette) at 0 s. The gradient was suddenly withdrawn from the cell start at 0 s, and reapplied at the 90 s. Regions of interest for the data reported in B and C are also shown. Animated version is in the supplemental materials (Video 4, available at
http://www.jcb.org/cgi/content/full/jcb.200611096/DC1
). (F) Temporal changes in cAMP concentrations in the front (black) and back (gray) are shown in the time course. (G) Temporal changes in relative levels of membrane-bound PTEN in the front (black) and back (gray) regions are shown in the time course. (H) Kinetics of membrane-bound PTEN in the front and back are shown as means ± SD (n = 13) in response to a withdrawal and reapplied of the cAMP gradient.
Figure 6.
Gradient sensing appears normal in the cells lacking Gα9 and Gα1 subunits. (A and B) Gα9 null cells expressing PHCrac-GFP were stimulated by a uniformly applied cAMP (A) or by a cAMP gradient (B, and Fig. S4 A). (C and D) Gα1 null cells expressing PHCrac-GFP were stimulated by a uniformly applied cAMP (C) or by a cAMP gradient (D). Stimulations were applied at time 0. Temporal changes in relative levels of PHCrac-GFP in the membrane are shown in the time course.
Figure 7.
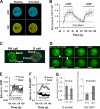
An inverted PHCrac-GFP translocation can be induced by a reapplied cAMP gradient. (A) In a stable cAMP gradient, PHCrac-GFP enriched in the front of a WT cell at 0 s. Upon the withdrawal of the cAMP gradient at 0 s, PHCrac-GFP gradually returned to the cytosol. At 81 s, the same gradient was reapplied around the cell, PHCrac-GFP initially translocated to the back side of the cell and formed a clear crescent from 93 s to 177 s. From 201 s, the PHCrac-GFP crescent started to turn toward the front, and the crescent eventually localized in the front of the cell. Images were captured at 2-s intervals, and the frames at selected time points are shown. Regions of interest used to assess concentration changes in cAMP and dynamics of PHCrac-GFP in the front and back of a cell are shown. Video 5 shows a full set of images from one experiment (available at
http://www.jcb.org/cgi/content/full/jcb.200611096/DC1
). Another example is shown as Fig. S2 and Video 6. Regions of interest used to assess concentration changes in cAMP and PHCrac-GFP are shown. Front (DF) and back (DB) regions used to evaluate quantitative changes of Alexa 594 as a measure of cAMP concentration. PHF and PHB were selected membrane regions used for monitoring the responses of PHCrac-GFP translocation to the front and back of the cell, respectively. (B) Temporal changes in cAMP concentrations (top panel) and in PHCrac-GFP (bottom panel) in the front (black) and the back (gray) regions of the cell. (C) After a withdrawal of gradients, new gradients were applied to the PH cells that were in the transients from polarized stages to resting stages. The fronts of the cells were exposed to higher concentrations of cAMP, comparing DF to DB (cAMP concentration in the back). Means ± SD are shown (n = 8). (D) PHCrac-GFP initially translocated only to the back of the cells, comparing PH-B to PH-F. Maximal PHCrac-GFP translocation responses are shown as means ± SD (n = 8). The basal levels are 1, indicated as the thin dashed line. (E and F) In pten − cells, the inverted PHCrac-GFP translocations were induced by a reapplied cAMP stimulation. The white arrows indicate the direction of PHCrac-GFP accumulation. The red arrows indicate the directions of cAMP gradients. Images were captured at 3-s intervals, and the frames at selected time points are shown.
Figure 8.
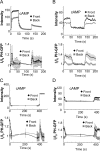
Kinetics of the asymmetrically distributed inhibition. (A and B) Asymmetrically distributed inhibition is not induced by exposure to an initial cAMP gradient for just 50 s. PH cells were suddenly exposed to a cAMP gradient (1 μM) at 0 s for 50 s. After a withdrawal of the gradient for ∼70 s, a uniform cAMP stimulation (100 nM) induced PHCrac-GFP translocation in both the original front and the back regions (A); and a reapplied cAMP gradient triggered a clear PHCrac-GFP translocation in the original front (B). (C and D) The asymmetrical inhibition disappears 6 min after the removal of the cAMP gradient. PH cells had been exposed to a cAMP gradient (1 μM) for more than two min, and PHCrac-GFP became stably polarized in the front of the cells. The cAMP gradient was removed from the cells at 0s. After a removal of the gradient for 6 min, a uniform cAMP stimulation (100 nM) induced a PHCrac-GFP translocation in both the original front and the back regions (C), and a reapplied cAMP gradient triggered PHCrac-GFP translocations to both the original front and back regions.
Figure 9.
Dynamic signaling events in a cell exposed to a gradient of cAMP leading to PIP3 polarization, followed by a withdrawal of the gradient and then reapplying the gradient inducing an inverted PIP3 response. (A) A cell is shown schematically at several time points, indicating the distributions of extracellular cAMP (red) and intracellular PHCrac-GFP (green) in the front (F) and back (B) regions. (B) A scheme of GPCR-mediated signaling network containing inhibitory mechanisms. Dynamics of signaling molecules that are filled with colors were measured in living cells. Activation of GPCR: cAMP (red), G protein dissociation, free Gβγ (gray), membrane-bound PTEN (blue), membrane-bound PI3K (light blue), PIP3 levels (green), and inhibitory components (black box). (C) Graphs represent a time course of relative signaling levels in the front and back of a cell. A naive cell at resting stage is suddenly exposed to a stable cAMP gradient at time 0. The cell reaches a polarized steady-state at 120 s. At the time T, the cAMP gradient is quickly removed, the cell starts to return to its resting stage. Before the cell completely returns to the resting stage, the cAMP gradient is reapplied, and the cell generates an inverted PIP3 response at time “In”. During this time course, the relative levels of extracellular cAMP (red), the extent of G protein dissociation (gray), membrane-associated PHCrac-GFP (green) as a measure of PIP3 levels, membrane-associated PTEN (blue), the amount of membrane-associated PI3K (light blue, the PI3K activity has not been directly measured. Temporal changes in PI3K activity was simulated, shown in Fig. S5), and the proposed inhibition (black dash lines) in the front and back of the cell are shown.
Similar articles
- Ras inhibitors gate chemoattractant concentration range for chemotaxis through controlling GPCR-mediated adaptation and cell sensitivity.
Xu X, Jin T. Xu X, et al. Front Immunol. 2022 Oct 20;13:1020117. doi: 10.3389/fimmu.2022.1020117. eCollection 2022. Front Immunol. 2022. PMID: 36341344 Free PMC article. Review. - Quantitative imaging of single live cells reveals spatiotemporal dynamics of multistep signaling events of chemoattractant gradient sensing in Dictyostelium.
Xu X, Meier-Schellersheim M, Jiao X, Nelson LE, Jin T. Xu X, et al. Mol Biol Cell. 2005 Feb;16(2):676-88. doi: 10.1091/mbc.e04-07-0544. Epub 2004 Nov 24. Mol Biol Cell. 2005. PMID: 15563608 Free PMC article. - Uniform cAMP stimulation of Dictyostelium cells induces localized patches of signal transduction and pseudopodia.
Postma M, Roelofs J, Goedhart J, Gadella TW, Visser AJ, Van Haastert PJ. Postma M, et al. Mol Biol Cell. 2003 Dec;14(12):5019-27. doi: 10.1091/mbc.e03-08-0566. Epub 2003 Oct 31. Mol Biol Cell. 2003. PMID: 14595105 Free PMC article. - Distinct roles of PI(3,4,5)P3 during chemoattractant signaling in Dictyostelium: a quantitative in vivo analysis by inhibition of PI3-kinase.
Loovers HM, Postma M, Keizer-Gunnink I, Huang YE, Devreotes PN, van Haastert PJ. Loovers HM, et al. Mol Biol Cell. 2006 Apr;17(4):1503-13. doi: 10.1091/mbc.e05-09-0825. Epub 2006 Jan 18. Mol Biol Cell. 2006. PMID: 16421252 Free PMC article. - Gradient sensing during chemotaxis.
Jin T. Jin T. Curr Opin Cell Biol. 2013 Oct;25(5):532-7. doi: 10.1016/j.ceb.2013.06.007. Epub 2013 Jul 20. Curr Opin Cell Biol. 2013. PMID: 23880435 Review.
Cited by
- Local negative feedback of Rac activity at the leading edge underlies a pilot pseudopod-like program for amoeboid cell guidance.
Town JP, Weiner OD. Town JP, et al. PLoS Biol. 2023 Sep 25;21(9):e3002307. doi: 10.1371/journal.pbio.3002307. eCollection 2023 Sep. PLoS Biol. 2023. PMID: 37747905 Free PMC article. - Ras inhibitors gate chemoattractant concentration range for chemotaxis through controlling GPCR-mediated adaptation and cell sensitivity.
Xu X, Jin T. Xu X, et al. Front Immunol. 2022 Oct 20;13:1020117. doi: 10.3389/fimmu.2022.1020117. eCollection 2022. Front Immunol. 2022. PMID: 36341344 Free PMC article. Review. - Gradients of PI(4,5)P2 and PI(3,5)P2 Jointly Participate in Shaping the Back State of Dictyostelium Cells.
Li D, Sun F, Yang Y, Tu H, Cai H. Li D, et al. Front Cell Dev Biol. 2022 Feb 4;10:835185. doi: 10.3389/fcell.2022.835185. eCollection 2022. Front Cell Dev Biol. 2022. PMID: 35186938 Free PMC article. - A systems approach to investigate GPCR-mediated Ras signaling network in chemoattractant sensing.
Xu X, Quan W, Zhang F, Jin T. Xu X, et al. Mol Biol Cell. 2022 Mar 1;33(3):ar23. doi: 10.1091/mbc.E20-08-0545. Epub 2021 Dec 15. Mol Biol Cell. 2022. PMID: 34910560 Free PMC article. - Ras inhibitor CAPRI enables neutrophil-like cells to chemotax through a higher-concentration range of gradients.
Xu X, Wen X, Moosa A, Bhimani S, Jin T. Xu X, et al. Proc Natl Acad Sci U S A. 2021 Oct 26;118(43):e2002162118. doi: 10.1073/pnas.2002162118. Proc Natl Acad Sci U S A. 2021. PMID: 34675073 Free PMC article.
References
- Arrieumerlou, C., and T. Meyer. 2005. A local coupling model and compass parameter for eukaryotic chemotaxis. Dev. Cell. 8:215–227. - PubMed
- Bominaar, A.A., and P.J. Van Haastert. 1993. Chemotactic antagonists of cAMP inhibit Dictyostelium phospholipase C. J. Cell Sci. 104:181–185. - PubMed
- Charest, P.G., and R.A. Firtel. 2006. Feedback signaling controls leading-edge formation during chemotaxis. Curr. Opin. Genet. Dev. 16:339–347. - PubMed
- Chung, C.Y., S. Funamoto, and R.A. Firtel. 2001. a. Signaling pathways controlling cell polarity and chemotaxis. Trends Biochem. Sci. 26:557–566. - PubMed
Publication types
MeSH terms
Substances
LinkOut - more resources
Full Text Sources
Other Literature Sources
Molecular Biology Databases
Research Materials
