A local reduction in cortical GABAergic synapses after a loss of endogenous brain-derived neurotrophic factor, as revealed by single-cell gene knock-out method - PubMed (original) (raw)
Comparative Study
A local reduction in cortical GABAergic synapses after a loss of endogenous brain-derived neurotrophic factor, as revealed by single-cell gene knock-out method
Keigo Kohara et al. J Neurosci. 2007.
Abstract
To address questions of whether brain-derived neurotrophic factor (BDNF) released from active excitatory neurons acts locally only on GABAergic presynaptic terminals contacting these neurons or generally also on GABAergic terminals contacting other inactive neurons, we developed a single-cell gene knock-out method in organotypic slice culture of visual cortex of floxed BDNF transgenic mice. A biolistic transfection of Cre recombinase with green fluorescence protein (GFP) plasmids to layer II/III of the cortex resulted in loss of BDNF in a single neuron or a small number of neurons, which expressed GFP at 13-14 d in vitro. Analysis with in situ hybridization and immunohistochemistry confirmed that neurons expressing GFP lacked BDNF mRNA and protein, respectively. Analysis with immunohistochemistry using antibody against GABA synthesizing enzyme showed that the number of GABAergic terminals on the soma of BDNF knock-out neurons was smaller than that of neighboring control neurons. Morphological analysis indicated that there was no significant difference in the soma size and branch points and length of dendrites between the BDNF knock-out and control neurons. Recordings of miniature IPSCs (mIPSCs) showed that the frequency of mIPSCs of BDNF knock-out neurons was lower than that of control neurons, although the amplitude was not significantly different, suggesting the smaller number of functional GABAergic synapses on whole the BDNF knock-out neuron. The present results suggest that BDNF released from postsynaptic target neurons promotes the formation or proliferation of GABAergic synapses through its local actions in layer II/III of visual cortex.
Figures
Figure 1.
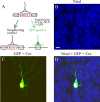
Biolistic transfection of GFP and Cre into a single cortical neuron. A, A schematic drawing showing that transfection of Cre– nuclear localized signal (NLS) induces a deletion of BDNF gene from neurons of floxed BDNF transgenic mice. Transfected neurons were marked with GFP fluorescence. B, An image of cortical slice, in which somas of many neurons were visualized in blue by fluorescent Nissl staining. Scale bar: (in B) B–D, 10 μm. C, An image of a transfected neuron that expresses GFP (green) in the soma and dendrites and Cre (yellow) in the nucleus. D, A superimposed image of B and C.
Figure 2.
Absence of BDNF mRNA and deletion of BDNF protein in a GFP-positive cell. A, Fluorescent image of in situ hybridization of GFP mRNA. The arrow indicates a transfected neuron that expressed green signal. Scale bar: B–D, 10 μm. B, Image of in situ hybridization of BDNF mRNA. The arrow indicates that the cell that expressed GFP mRNA in A does not have BDNF mRNA. C, Superposed image of A and B. Note the deletion of BDNF mRNA in the cell with GFP mRNA. D, Control image of in situ hybridization by BDNF sense probe. E, Fluorescent image of Nissl staining (blue) of cortical slices. Scale bar: F–H, 10 μm. F, Fluorescent image of GFP-positive neuron (green), which was immunohistochemically stained with anti-GFP antibody. G, Fluorescent image of BDNF (red). Arrows indicate a GFP-positive transfected neuron. H, Superposed image of GFP and BDNF.
Figure 3.
Reduction of GABAergic presynaptic boutons across the soma of BDNF-KO neurons. A, Superposed image of a biocytin-injected cell (red) and a GFP-expressing cell (green). The former is a fast-spiking neuron, and the latter is a BDNF-KO neuron. Scale bar, 30 μm. B, Superposed image of the biocytin-injected cell stained immunohistochemically by anti-GAD65 antibody (yellow). Scale bar, 30 μm. C1, Superposed image of biocytin (red) and Nissl (blue) staining of the square C in A. Biocytin image was stacked on the Nissl image. C2, Superposed image of biocytin (red), Nissl (blue), and anti-GAD65 (yellow) staining of the same frame as C1. D1, Superposed image of biocytin (red) and Nissl (blue) staining of the frame shown as the square D in A. D2, Superposed image of biocytin (red), Nissl (blue), and anti-GAD65 (yellow) staining of the same frame as D1. E, Stack numbers of GAD65-positive boutons around the somas of BDNF-KO neurons and near- and far-located control neurons. Hatched columns indicate the stack number of both biocytin- and GAD65-positive boutons. The mean and SEM of the eight cells each. F, Area of the soma of the three groups of cells, as indicated. The mean and SEM of the eight cells each.
Figure 4.
Relationship between the stack and single-section numbers of the total GAD65-positive boutons around GFP-positive (filled circles), near-control (open circles), and far-control (open diamonds) cells, respectively. Near-control cells were innervated by the same GABAergic neurons as the corresponding GFP-positive cells. Dotted lines represent a regression line of the correlation diagram.
Figure 5.
Reduction of GABAergic presynaptic terminals around the soma of BDNF-KO neurons. A, Fluorescent image of a GFP-expressing neuron (green). Scale bar: (in A), A–C, 10 μm. B, Fluorescent image of GAD65-positive presynaptic pucnta (red). C, Superposed image of A and B. Green and white arrows indicate GAD65-positve puncta around the soma of BDNF-KO and neighboring control neurons, respectively. D, Mean numbers of GAD65-positive puncta around soma of BDNF-KO and neighboring control neurons. Error bars indicate SEM. E, Mean area of soma of the BDNF-KO and neighboring control neurons.
Figure 6.
No difference in the number of GABAergic presynaptic terminals around the soma between GFP-positive and -negative neurons of wild-type mice. A, Fluorescent image of a GFP-expressing neuron (green). Scale bar: B, C, 10 μm. B, Fluorescent image of GAD65-positive presynaptic puncta (red). C, Superposed image of A and B. Green and white arrows indicate GAD65-positve puncta around the soma of GFP-expressing and neighboring control neurons, respectively.
Figure 7.
Increase in the number of GABAergic synaptic terminals with days in vitro. The mean numbers of GAD65-positive puncta around the soma of neurons in the single confocal section are plotted at days in vitro indicated at the abscissa. The mean ± SEM values at 6, 9, 12, and 15 DIV are 2.1 ± 0.3, 4.1 ± 0.4, 6.2 ± 0.4, and 7.6 ± 0.5, respectively. The numbers of cells at each group are shown in parentheses.
Figure 8.
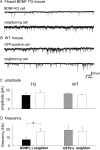
Reduction in the frequency of mIPSCs of BDNF-KO neurons. A, Representative traces of mIPSC recordings from BDNF-KO and neighboring control neurons in visual cortex of a floxed BDNF transgenic (TG) mouse in the presence of CNQX and AP-5 and TTX. B, Representative traces of mIPSC recordings from GFP-expressing and neighboring neurons in visual cortex of a wild-type mouse in the presence of CNQX and AP-5 and TTX. C, Mean amplitudes of mIPSCs recorded from BDNF-KO and neighboring control neurons of floxed BDNF transgenic mice (first and second columns, respectively) and GFP-positive and neighboring neurons of wild-type (WT) mice (third and fourth columns, respectively). Error bars indicate SEMs. D, Mean frequencies of mIPSCs recorded from BDNF-KO and neighboring control neurons of floxed BDNF transgenic mice (first and second columns, respectively) and GFP-positive and neighboring neurons of wild-type mice (third and fourth columns, respectively). *p < 0.05, statistically significant difference (paired t test).
Figure 9.
No difference in morphology of dendrites between BDNF-KO and neighboring control neurons. A, B, Images of a GFP-positive neuron that had no BDNF and a neighboring control neurons, respectively. Scale bar: (in A) A, B, 50 μm.
Figure 10.
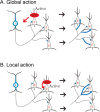
Two possible routes through which BDNF acts on inhibitory synapses. A, Global action of BDNF. BDNF increases the number of GABAergic synapses not only at active, excitatory neurons but also at other excitatory neurons innervated by the same GABAergic neuron. Blue fibers and terminals boutons represent newly formed GABAergic synapses. B, Local action of BDNF. BDNF increases the number of GABAergic synapses only at an active, excitatory neuron. Other conventions are the same as in A. I, Inhibitory; E, excitatory.
Similar articles
- Brain-derived neurotrophic factor increases inhibitory synapses, revealed in solitary neurons cultured from rat visual cortex.
Palizvan MR, Sohya K, Kohara K, Maruyama A, Yasuda H, Kimura F, Tsumoto T. Palizvan MR, et al. Neuroscience. 2004;126(4):955-66. doi: 10.1016/j.neuroscience.2004.03.053. Neuroscience. 2004. PMID: 15207329 - Brain-derived neurotrophic factor acutely depresses excitatory synaptic transmission to GABAergic neurons in visual cortical slices.
Jiang B, Kitamura A, Yasuda H, Sohya K, Maruyama A, Yanagawa Y, Obata K, Tsumoto T. Jiang B, et al. Eur J Neurosci. 2004 Aug;20(3):709-18. doi: 10.1111/j.1460-9568.2004.03523.x. Eur J Neurosci. 2004. PMID: 15255981 - Impaired GABAergic inhibition in the visual cortex of brain-derived neurotrophic factor heterozygous knockout mice.
Abidin I, Eysel UT, Lessmann V, Mittmann T. Abidin I, et al. J Physiol. 2008 Apr 1;586(7):1885-901. doi: 10.1113/jphysiol.2007.148627. Epub 2008 Jan 31. J Physiol. 2008. PMID: 18238806 Free PMC article. - Functions and mechanisms of BDNF mRNA trafficking.
Tongiorgi E, Baj G. Tongiorgi E, et al. Novartis Found Symp. 2008;289:136-47; discussion 147-51, 193-5. doi: 10.1002/9780470751251.ch11. Novartis Found Symp. 2008. PMID: 18497100 Review. - The contribution of GABAergic dysfunction to neurodevelopmental disorders.
Ramamoorthi K, Lin Y. Ramamoorthi K, et al. Trends Mol Med. 2011 Aug;17(8):452-62. doi: 10.1016/j.molmed.2011.03.003. Epub 2011 Apr 21. Trends Mol Med. 2011. PMID: 21514225 Free PMC article. Review.
Cited by
- Single-Cell Labeling Strategies to Dissect Neuronal Structures and Local Functions.
Kohara K, Okada M. Kohara K, et al. Biology (Basel). 2023 Feb 16;12(2):321. doi: 10.3390/biology12020321. Biology (Basel). 2023. PMID: 36829594 Free PMC article. Review. - Effects of negative stressors on DNA methylation in the brain: implications for mood and anxiety disorders.
Hing B, Gardner C, Potash JB. Hing B, et al. Am J Med Genet B Neuropsychiatr Genet. 2014 Oct;165B(7):541-54. doi: 10.1002/ajmg.b.32265. Epub 2014 Aug 19. Am J Med Genet B Neuropsychiatr Genet. 2014. PMID: 25139739 Free PMC article. Review. - Excitation/inhibition imbalance and impaired synaptic inhibition in hippocampal area CA3 of Mecp2 knockout mice.
Calfa G, Li W, Rutherford JM, Pozzo-Miller L. Calfa G, et al. Hippocampus. 2015 Feb;25(2):159-68. doi: 10.1002/hipo.22360. Epub 2014 Sep 25. Hippocampus. 2015. PMID: 25209930 Free PMC article. - Targets for preventing epilepsy following cortical injury.
Li H, McDonald W, Parada I, Faria L, Graber K, Takahashi DK, Ma Y, Prince D. Li H, et al. Neurosci Lett. 2011 Jun 27;497(3):172-6. doi: 10.1016/j.neulet.2011.02.042. Epub 2011 Feb 24. Neurosci Lett. 2011. PMID: 21354270 Free PMC article. Review. - Distinct subsets of Syt-IV/BDNF vesicles are sorted to axons versus dendrites and recruited to synapses by activity.
Dean C, Liu H, Staudt T, Stahlberg MA, Vingill S, Bückers J, Kamin D, Engelhardt J, Jackson MB, Hell SW, Chapman ER. Dean C, et al. J Neurosci. 2012 Apr 18;32(16):5398-413. doi: 10.1523/JNEUROSCI.4515-11.2012. J Neurosci. 2012. PMID: 22514304 Free PMC article.
References
- Baldelli P, Novara M, Carabelli V, Hernandez-Guijo J-M, Carbone E. BDNF up-regulates evoked GABAergic transmission in developing hippocampal neurons by potentiating presynaptic N- and P/Q-type Ca2+ channel signaling. Eur J Neurosci. 2002;16:2297–2310. - PubMed
- Bibel M, Barde YA. Neurotrophins: key regulators of cell fate and cell shape in the vertebrate nervous system. Genes Dev. 2000;14:2920–2935. - PubMed
Publication types
MeSH terms
Substances
LinkOut - more resources
Full Text Sources


