Inflammatory multiple-sclerosis plaques generate characteristic metabolic profiles in cerebrospinal fluid - PubMed (original) (raw)
Inflammatory multiple-sclerosis plaques generate characteristic metabolic profiles in cerebrospinal fluid
Norbert W Lutz et al. PLoS One. 2007.
Abstract
Background: Multiple sclerosis (MS), an inflammatory disease of the central nervous system, manifests itself in numerous forms and stages. A number of brain metabolic alterations have been reported for MS patients vs. control subjects. However, metabolite profiles of cerebrospinal fluid (CSF) are not consistent among the published MS studies, most probably due to variations in the patient cohorts studied. We undertook the first investigation of highly homogeneous MS patient cohorts to determine characteristic effects of inflammatory MS plaques on the CSF metabolome, including only patients with clinically isolated syndrome (CIS) with or without inflammatory brain plaques, and controls.
Methodology/principal findings: CSF obtained by lumbar puncture was analyzed by proton magnetic resonance spectroscopy. 27 metabolites were quantified. Differences between groups of control subjects (n = 10), CIS patients with (n = 21) and without (n = 12) inflammatory plaques were evaluated by univariate statistics and principal component analysis (PCA). Seven metabolites showed statistically significant inter-group differences (p<0.05). Interestingly, a significant increase in beta-hydroxyisobutyrate (BHIB) was detected in CIS with vs. without active plaques, but not when comparing either CIS group with control subjects. Moreover, a significant correlation was found, for the first time, between CSF lactate concentration and the number of inflammatory MS brain plaques. In contrast, fructose concentrations were equally enhanced in CIS with or without active plaques. PCA based on all 27 metabolites yielded group-specific clusters.
Conclusions/significance: CSF metabolic profiles suggest a close link between MS plaque activity in CIS patients on the one hand and organic-acid metabolism on the other. Our detection of increased BHIB levels points to a hitherto unsuspected role for this compound in MS with active plaques, and serves as a basis for further investigation. The metabolic effects described in our study are crucial elements in the explanation of biochemical mechanisms involved in specific MS manifestations.
Conflict of interest statement
Competing Interests: The authors have declared that no competing interests exist.
Figures
Figure 1. Selected CSF metabolite concentrations [mM] in patients with or without inflammatory brain MS plaques (abbreviated ‘inflamm’ and ‘non-infl’, respectively), and controls.
Data represent means±s.e.m.
Figure 2. Percentile plots for selected CSF metabolite concentrations [mM] in patients with or without inflammatory brain MS plaques (abbreviated ‘inflamm’ and ‘non-inflamm’, respectively), and controls.
These plots show the percentage of data less than or equal to an observed value. Marked deviations from normal distribution are readily recognized by major deviations from a straight line. The percentile plots for fructose illustrate the presence of CSF with particularly increased concentrations in CIS patients, independently of the presence of inflammatory plaques.
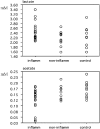
Figure 3. Scattergrams for lactate and acetate CSF concentrations [mM] in patients with or without inflammatory brain MS plaques (abbreviated ‘inflamm’ and ‘non-inflamm’, respectively), and controls.
Marked deviations from normal distribution are readily recognized for lactate (inflamm) since data are clustered at low values (around 2.2 mM), but also for acetate (inflamm) where data are clustered at high values (around 0.16 mM).
Figure 4. Lactate concentration [mM] in CSF of CIS patients with inflammatory plaques vs. number of inflammatory plaques, with linear fit.
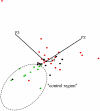
Figure 5. Two-dimensional projection of a three-dimensional CSF metabolite plot, based on the first three principal components obtained by PCA.
All control subjects (green dots) are clustered within the broken ellipse that also contains one data point from each of the groups with and without inflammatory plaques (red and black dots, respectively).
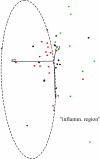
Figure 6. Two-dimensional projection of a three-dimensional CSF metabolite plot, based on the first three principal components obtained by PCA (projection angle changed relative to Figure 5).
All CIS patients with inflammatory plaques (red dots), except for two, are clustered within the broken ellipse that also contains four data points from patients without inflammatory plaques (black dots).
Similar articles
- High resolution proton MR spectroscopy of cerebrospinal fluid in MS patients. Comparison with biochemical changes in demyelinating plaques.
Simone IL, Federico F, Trojano M, Tortorella C, Liguori M, Giannini P, Picciola E, Natile G, Livrea P. Simone IL, et al. J Neurol Sci. 1996 Dec;144(1-2):182-90. doi: 10.1016/s0022-510x(96)00224-9. J Neurol Sci. 1996. PMID: 8994122 Clinical Trial. - Translational Metabolomics of Head Injury: Exploring Dysfunctional Cerebral Metabolism with Ex Vivo NMR Spectroscopy-Based Metabolite Quantification.
Wolahan SM, Hirt D, Glenn TC. Wolahan SM, et al. In: Kobeissy FH, editor. Brain Neurotrauma: Molecular, Neuropsychological, and Rehabilitation Aspects. Boca Raton (FL): CRC Press/Taylor & Francis; 2015. Chapter 25. In: Kobeissy FH, editor. Brain Neurotrauma: Molecular, Neuropsychological, and Rehabilitation Aspects. Boca Raton (FL): CRC Press/Taylor & Francis; 2015. Chapter 25. PMID: 26269925 Free Books & Documents. Review. - Cerebrospinal Fluid Dynamics in Patients with Multiple Sclerosis: The Role of Phase-Contrast MRI in the Differential Diagnosis of Active and Chronic Disease.
Öner S, Kahraman AS, Özcan C, Özdemir ZM, Ünlü S, Kamışlı Ö, Öner Z. Öner S, et al. Korean J Radiol. 2018 Jan-Feb;19(1):72-78. doi: 10.3348/kjr.2018.19.1.72. Epub 2018 Jan 2. Korean J Radiol. 2018. PMID: 29354002 Free PMC article. - Axonal damage in multiple sclerosis plaques: a combined magnetic resonance imaging and 1H-magnetic resonance spectroscopy study.
Simone IL, Tortorella C, Federico F, Liguori M, Lucivero V, Giannini P, Carrara D, Bellacosa A, Livrea P. Simone IL, et al. J Neurol Sci. 2001 Jan 1;182(2):143-50. doi: 10.1016/s0022-510x(00)00464-0. J Neurol Sci. 2001. PMID: 11137520 - Oligoclonal bands in multiple sclerosis cerebrospinal fluid: an update on methodology and clinical usefulness.
Link H, Huang YM. Link H, et al. J Neuroimmunol. 2006 Nov;180(1-2):17-28. doi: 10.1016/j.jneuroim.2006.07.006. Epub 2006 Sep 1. J Neuroimmunol. 2006. PMID: 16945427 Review.
Cited by
- Optic Neuritis in Multiple Sclerosis-A Review of Molecular Mechanisms Involved in the Degenerative Process.
Ciapă MA, Șalaru DL, Stătescu C, Sascău RA, Bogdănici CM. Ciapă MA, et al. Curr Issues Mol Biol. 2022 Sep 2;44(9):3959-3979. doi: 10.3390/cimb44090272. Curr Issues Mol Biol. 2022. PMID: 36135184 Free PMC article. Review. - Recent advances in understanding multiple sclerosis.
Stys PK, Tsutsui S. Stys PK, et al. F1000Res. 2019 Dec 13;8:F1000 Faculty Rev-2100. doi: 10.12688/f1000research.20906.1. eCollection 2019. F1000Res. 2019. PMID: 31885862 Free PMC article. Review. - Cerebrospinal fluid lactate in dogs with inflammatory central nervous system disorders.
Mariani CL, Nye CJ, Tokarz DA, Green L, Lau J, Zidan N, Early PJ, Guevar J, Muñana KR, Olby NJ, Miles S. Mariani CL, et al. J Vet Intern Med. 2019 Nov;33(6):2701-2708. doi: 10.1111/jvim.15606. Epub 2019 Sep 24. J Vet Intern Med. 2019. PMID: 31549740 Free PMC article. - Urinary and Plasma Metabolomics Identify the Distinct Metabolic Profile of Disease State in Chronic Mouse Model of Multiple Sclerosis.
Singh J, Cerghet M, Poisson LM, Datta I, Labuzek K, Suhail H, Rattan R, Giri S. Singh J, et al. J Neuroimmune Pharmacol. 2019 Jun;14(2):241-250. doi: 10.1007/s11481-018-9815-4. Epub 2018 Oct 12. J Neuroimmune Pharmacol. 2019. PMID: 30315511 - Metabolomic profiling of CSF in multiple sclerosis and neuromyelitis optica spectrum disorder by nuclear magnetic resonance.
Kim HH, Jeong IH, Hyun JS, Kong BS, Kim HJ, Park SJ. Kim HH, et al. PLoS One. 2017 Jul 26;12(7):e0181758. doi: 10.1371/journal.pone.0181758. eCollection 2017. PLoS One. 2017. PMID: 28746356 Free PMC article.
References
- Bruck W, Stadelmann C. The spectrum of multiple sclerosis: new lessons from pathology. Curr Opin Neurol. 2005;18:221–224. - PubMed
- Filippi M. In-vivo tissue characterization of multiple sclerosis and other white matter diseases using magnetic resonance based techniques. J Neurol. 2001;248:1019–1029. - PubMed
- Nicoli F, Vion-Dury J, Confort-Gouny S, Maillet S, Gastaut J-L, et al. Cerebrospinal fluid metabolic profiles in multiple sclerosis and degenerative dementias obtained by high resolution proton magnetic resonance spectroscopy. C R Acad Sci Paris. 1996;319:623–631. - PubMed
- Simone IL, Federico F, Trojano M, Tortorella C, Liguori M, et al. High resolution proton MR spectroscopy of cerebrospinal fluid in MS patients. Comparison with biochemical changes in demyelinating plaques. J Neurol Sci. 1996;144:182–190. - PubMed
- Aasly J, Garseth M, Sonnewald U, Zwart JA, White LR, et al. Cerebrospinal fluid lactate and glutamine are reduced in multiple sclerosis. Acta Neurol Scand. 1997;95:9–12. - PubMed
Publication types
MeSH terms
Substances
LinkOut - more resources
Full Text Sources
Other Literature Sources
Medical


