Mapping human whole-brain structural networks with diffusion MRI - PubMed (original) (raw)
Mapping human whole-brain structural networks with diffusion MRI
Patric Hagmann et al. PLoS One. 2007.
Abstract
Understanding the large-scale structural network formed by neurons is a major challenge in system neuroscience. A detailed connectivity map covering the entire brain would therefore be of great value. Based on diffusion MRI, we propose an efficient methodology to generate large, comprehensive and individual white matter connectional datasets of the living or dead, human or animal brain. This non-invasive tool enables us to study the basic and potentially complex network properties of the entire brain. For two human subjects we find that their individual brain networks have an exponential node degree distribution and that their global organization is in the form of a small world.
Conflict of interest statement
Competing Interests: The authors have declared that no competing interests exist.
Figures
Figure 1. Mapping the network of brain structural connectivity with diffusion MRI is a process made of four steps.
First, Diffusion Spectrum MRI (DSI) is performed on a subject or sample. This acquisition provides a 3D diffusion function at every location in the brain. This data set is called a diffusion map. It is shaped by the local tissue characteristics, in particular by the orientation of axonal bundles existing in the brain. Second, based on this map we generate a number of 3D curves (called fibers) that follow the path laid by the white matter axonal bundles. Third, independently from the previous step, we use a heuristic that partitions the brain white matter-gray matter interface into small areas of equal surface (called Regions Of Interest-ROIs) covering the whole cortex and deep cerebral nuclei boundaries. Finally, in the fourth step, we combine the output of steps two and three: the ROIs become nodes and the fibers are transformed into edges in the resulting graph. This graph estimates the density of white matter connections between any two regions of gray matter.
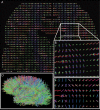
Figure 2. Tractography.
A) The result of the “diffusion MRI acquisition” step. In every voxel of a coronal slide the Orientation Density Function (ODF) captures locally for every direction the diffusion “intensity”. B) Zoom in the centrum semi-ovale C) Each ODF is replaced by a set of vectors defining its local maxima. D) Fibers are computed following the local diffusion maxima; they are uniformly initiated over the whole brain white matter. See also Video S1 in Supporting Information.
Figure 3. Basic characteristics of nodes in the graph of brain connectivity.
P(d) [_P(s)_] is the probability that a randomly chosen node has the degree [strength] equal to d [_s_]. The node degree distribution (a) and node strength distribution (b) are lin-binned and plotted in log-lin scale. Color code: subject 1 (blue circles), subject 2 (green diamonds)
Figure 4. Basic characteristics of edges in the graph of brain connectivity.
(a) The distribution of edge lengths l in log-lin scale, lin-binned. (b) The distribution of edge weights w in log-log scale, log-binned. (c) Scatter plot of w vs l. The symbols are lin-binned average values for subject 1 (blue circles) and subject 2 (green diamonds).
Figure 5. Average shortest path <_sp_> and clustering coefficient c as a function of the number of edges in the brain graph |E'|.
The edges are chosen from the set of all edges E either giving the priority to the edges with high weights (“Top-weight edges”, left column), or based on a random subset of fibers (“Random fibers”, right column). As a reference we take a random graph with the same number of nodes and edges, and the same degree distribution. Color code: subject 1 (blue circles), subject 2 (green diamonds), random graph reference (black filled circles). The results are averaged over 10 realizations of the “random fibers” filtering and random graphs; the confidence intervals (not shown) are comparable with the symbol size.
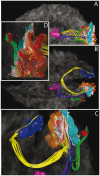
Visual system white matter connectivity derived from tractography: Views from the left (a), from the top (b), zoomed anterior (c) and posterior (d).
White matter–gray matter interfaces: Magenta = posterior part of the thalamus, blue and gray = right and left V1, orange = V2, cyan = V3, red = V5. Fibers: yellow = homotopic V1, red = V1–V2, white = V2–V3, green = V2–V5, blue = lateral geniculate body–V1. See also Video S3 in Supporting Information.
Similar articles
- Relating connectional architecture to grey matter function using diffusion imaging.
Behrens TE, Johansen-Berg H. Behrens TE, et al. Philos Trans R Soc Lond B Biol Sci. 2005 May 29;360(1457):903-11. doi: 10.1098/rstb.2005.1640. Philos Trans R Soc Lond B Biol Sci. 2005. PMID: 16087435 Free PMC article. Review. - Mapping the orientation of intravoxel crossing fibers based on the phase information of diffusion circular spectrum.
Zhan W, Stein EA, Yang Y. Zhan W, et al. Neuroimage. 2004 Dec;23(4):1358-69. doi: 10.1016/j.neuroimage.2004.07.062. Neuroimage. 2004. PMID: 15589100 - Normalization of similarity-based individual brain networks from gray matter MRI and its association with neurodevelopment in infants with intrauterine growth restriction.
Batalle D, Muñoz-Moreno E, Figueras F, Bargallo N, Eixarch E, Gratacos E. Batalle D, et al. Neuroimage. 2013 Dec;83:901-11. doi: 10.1016/j.neuroimage.2013.07.045. Epub 2013 Jul 22. Neuroimage. 2013. PMID: 23886985 - Track-weighted functional connectivity (TW-FC): a tool for characterizing the structural-functional connections in the brain.
Calamante F, Masterton RA, Tournier JD, Smith RE, Willats L, Raffelt D, Connelly A. Calamante F, et al. Neuroimage. 2013 Apr 15;70:199-210. doi: 10.1016/j.neuroimage.2012.12.054. Epub 2013 Jan 5. Neuroimage. 2013. PMID: 23298749 - New approaches for exploring anatomical and functional connectivity in the human brain.
Ramnani N, Behrens TE, Penny W, Matthews PM. Ramnani N, et al. Biol Psychiatry. 2004 Nov 1;56(9):613-9. doi: 10.1016/j.biopsych.2004.02.004. Biol Psychiatry. 2004. PMID: 15522243 Review.
Cited by
- A NOVEL SPATIO-TEMPORAL HUB IDENTIFICATION METHOD FOR DYNAMIC FUNCTIONAL NETWORKS.
Chen A, Yang D, Yan C, Peng Z, Kim M, Laurienti PJ, Wu G. Chen A, et al. Proc IEEE Int Symp Biomed Imaging. 2020 Apr;2020:1416-1419. doi: 10.1109/isbi45749.2020.9098728. Epub 2020 May 22. Proc IEEE Int Symp Biomed Imaging. 2020. PMID: 32934768 Free PMC article. - Recent Developments in Diffusion Tensor Imaging of Brain.
Parekh MB, Gurjarpadhye AA, Manoukian MA, Dubnika A, Rajadas J, Inayathullah M. Parekh MB, et al. Radiol Open J. 2015;1(1):1-12. doi: 10.17140/roj-1-101. Epub 2015 Dec 11. Radiol Open J. 2015. PMID: 27077135 Free PMC article. - Connectomic intermediate phenotypes for psychiatric disorders.
Fornito A, Bullmore ET. Fornito A, et al. Front Psychiatry. 2012 Apr 19;3:32. doi: 10.3389/fpsyt.2012.00032. eCollection 2012. Front Psychiatry. 2012. PMID: 22529823 Free PMC article. - A small world of weak ties provides optimal global integration of self-similar modules in functional brain networks.
Gallos LK, Makse HA, Sigman M. Gallos LK, et al. Proc Natl Acad Sci U S A. 2012 Feb 21;109(8):2825-30. doi: 10.1073/pnas.1106612109. Epub 2012 Feb 3. Proc Natl Acad Sci U S A. 2012. PMID: 22308319 Free PMC article. - Rethinking segregation and integration: contributions of whole-brain modelling.
Deco G, Tononi G, Boly M, Kringelbach ML. Deco G, et al. Nat Rev Neurosci. 2015 Jul;16(7):430-9. doi: 10.1038/nrn3963. Epub 2015 Jun 17. Nat Rev Neurosci. 2015. PMID: 26081790 Review.
References
- Koch C, Laurent G. Complexity and the nervous system. SCIENCE. 1999;284:96–98. - PubMed
- Tononi G, Edelman GM. Consciousness and complexity. Science. 1998;282:1846–1851. - PubMed
Publication types
MeSH terms
LinkOut - more resources
Full Text Sources
Other Literature Sources


