Depolarization activates the phosphoinositide phosphatase Ci-VSP, as detected in Xenopus oocytes coexpressing sensors of PIP2 - PubMed (original) (raw)
Depolarization activates the phosphoinositide phosphatase Ci-VSP, as detected in Xenopus oocytes coexpressing sensors of PIP2
Yoshimichi Murata et al. J Physiol. 2007.
Abstract
Voltage-evoked signals play critical roles in neural activities, muscle contraction and exocytosis. Ciona voltage-sensor containing phosphatase (Ci-VSP) consists of the transmembrane voltage sensor domain (VSD) and a cytoplasmic domain of phosphoinositide phosphatase, homologous to phosphatase and tensin homologue deleted on chromosome 10 (PTEN). Previous experiments utilizing potassium channels as the sensor for phosphoinositides have demonstrated that phosphatase activities of Ci-VSP are voltage dependent. However, it still remained unclear whether enzyme activity is activated by depolarization or hyperpolarization. Further, a large gap in voltage dependency was found between the charge movement of the VSD and potassium channel-reporting phosphatase activities. In this study, voltage-dependent dynamics of phosphoinositides mediated by Ci-VSP were examined by confocal imaging and electrical measurements in Xenopus oocytes. Imaging of phosphatidylinositol-4,5-bisphosphate (PtdIns(4,5)P(2)) using green fluorescent protein (GFP)-tagged pleckstrin homology (PH) domains from phospholipase C delta subunit (PLC-delta) showed that PtdIns(4,5)P(2) concentration is reduced during depolarization. In the presence of Ci-VSP, IRK1 channels with higher sensitivity to phosphoinositide than GIRK2 channels decreased their magnitude during depolarization over 0 mV, indicating that the PtdIns(4,5)P(2) level is reduced upon depolarization. KCNQ2/3 channels coexpressed with Ci-VSP exhibited voltage-dependent decay of the outward current that became sharper with higher depolarization in a voltage range up to 100 mV. These results indicate that Ci-VSP has an activity that depletes PtdIns(4,5)P(2) unlike PTEN and that depolarization-activated voltage sensor movement is translated into activation of phosphatase activity.
Figures
Figure 6
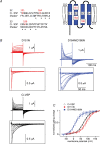
Shifted voltage dependency of ‘gating’ currents of the two VSD mutants, D164N/D186N and D151N A, comparison of the amino acid sequence of S2 and S3 with Shaker potassium channel (left) and positions of negatively charged amino acid residues in the topology of the voltage sensor domain (right). B, representative traces of ‘gating’ current measurements under the two-electrode voltage clamp of D151N (red), wild-type (Ci-VSP), Ci-VSP (black) and D164N/D186N (blue). Holding potential was −60 mV and step pulses were applied from −60 mV to 180 mV for wild-type and D151N, from −80 mV to 160 mV for D164N/D186N by 10 mV increment. Symmetrical capacitive component was subtracted by the P/–10 method. OFF-‘gating’ current traces are indicated at higher magnification (lower panel). Traces are shown only from −60 mV to 120 mV for wild-type and D151N, −80 mV to 100 mV for D164N/D186N by 30 mV increment for clarity. C, Q_off–_V curves of wild-type (black), D164N/D186N (blue) and D151N (red). The curve was fitted with the Boltzmann equation: Q =_Q_max/[1 + exp{zF(V_1/2−_V)/RT}]. _V_1/2 (mV) = 69.8 (Ci-VSP), 89.6 (D151N), 12.1 (D164N/D186N). z = 1.09 (wild-type), 1.06 (D151N), 1.15 (D164N/D186N).
Figure 5
Decay of KCNQ2/3 current is induced by Ci-VSP in a voltage-dependent manner A, KCNQ2/3 current coexpressed with (upper panel) or without (lower panel) Ci-VSP was recorded under the two-electrode voltage clamp. Holding potential was −60 mV, and step pulses were applied by 10 mV increment. KCNQ2/3 current showed ‘inactivation-like’ decay kinetics in the higher membrane potential condition (red traces). Transient outward notches at the onset of depolarization and inward notches at repolarization are ‘gating’ currents of Ci-VSP. Capacitative component was subtracted by P/–10 method. B, I–V relationships of traces shown in A (KCNQ2/3 only: open circles, KCNQ2/3 + Ci-VSP: filled circles) are shown. The red box indicates the voltage region where KCNQ2/3 current was decreased as shown in red traces in A. C, representative current traces with ‘inactivation-like’ decay kinetics of KCNQ2/3 currents (middle panel) by long depolarization (2 s). Intervals were set to 60 s at −60 mV (top panel). KCNQ2/3 coexpressed with enzyme-defective Ci-VSP mutant (C363S) did not exhibit such kinetics (bottom panel). Slowly activating outward current following decline of KCNQ2/3 current at high membrane potentials (ex. 110 mV) is probably due to endogenous current that often activates at this voltage range. D, voltage dependency of decay time constant of ‘inactivation-like’ kinetics in six oocytes. The decay phase of KCNQ2/3 current was fitted by single exponentials. The red curve is the charge–voltage curve (Q_off–_V) adopted from our previous study (Murata et al. 2005).
Figure 1
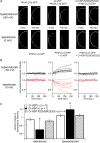
Confocal imaging with PtdIns(4,5)P2 sensitive PHPLC–GFP reports that PtdIns(4,5)P2 is decreased by Ci-VSP during membrane depolarization A, confocal images of oocytes under conditions of hyperpolarized (−60 mV) or depolarized (0 mV) membrane potential. GFP-fused PH domain of PLC-δ (PHPLC–GFP) was coexpressed with (middle panels) or without (left panels) Ci-VSP in Xenopus oocytes. Images just before changing membrane potential (0 s) and at the last timing of the step (160 s) are indicated as pairs. PHPLC–GFP coexpressed with Ci-VSP concentrated to and diffused from plasma membrane in the hyperpolarized (upper panel) and depolarized (lower panel) condition, respectively. When cell was inserted with two microelectrodes, it usually showed resting membrane potential ranging from −30 mV to −10 mV. Then the recording mode was switched to voltage clamp mode with holding potential of −60 mV for 160 seconds, stepped to 0 mV for 160 seconds, finally to −60 mV again for 160 seconds. Signals during the first hyperpolarizing stimulus are shown. Cells expressing PHPLC–GFP with voltage-insensitive Ci-VSP mutant (R229Q/R232Q) did not exhibit such translocation (right panel). B, temporal change of fluorescence intensity of GFP under voltage clamp. The intensity was standardized by the initial intensity. Individual traces were obtained from different cells. In the cells shown in A, intensities in the boxed regions were measured. C, averaged change of fluorescence intensity from multiple cells. Minimal (depolarized) or maximal (hyperpolarized) intensity during each recording was corrected by the intensity at time zero in individual cell. Asterisks indicate a statistically significant difference (P < 0.05) from Ci-VSP(–) cells.
Figure 2
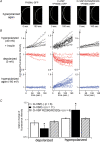
Btk-derived (PtdIns(3,4,5)P3-sensitive) PH-domain fused with GFP reports that Ci-VSP decreases PtdIns(3,4,5)P3 upon membrane depolarization A, confocal images taken just before applying the second hyperpolarizing episode and just before the end of the episode in each example of the cell only with GFP-fused PH domain of Btk (PHBtk–GFP) (left panels), with Ci-VSP and PHBtk–GFP (middle panels) and with VSD mutant of Ci-VSP with PHBtk–GFP (right panels). Oocytes were primed to activate PI-3 kinase to increase PtdIns(3,4,5)P3 level by applying insulin (8 μ
m
: applied in the time indicated by arrow in top panels of B). After insulin application, translocation of PHBtk–GFP exhibited similar voltage dependence to that of PHPLC–GFP: depolarization decreased the signal, whereas hyperpolarization increased the signal. B, temporal changes of fluorescence intensity during hyperpolarization (−60 mV) or depolarization (0 mV) are shown. Individual traces were obtained from different cells. Measured areas are indicated as boxes in A. C, statistical representation of B. Analysis was performed in a similar manner as in Fig. 1_C_. Asterisks indicate a statistically significant difference (P < 0.05) from Ci-VSP(–) cells.
Figure 3
Voltage-dependent kinetics of run-down of GIRK2 current A, families of Kir currents of GIRK2 channels when interval voltage was set to 0, 20 or 40 mV. Preceding these recordings, cells were held at −60 mV for 60 s. Raw current traces elicited during repetitive test pulses to −100 mV every 500 ms are superimposed. Following test pulses, cells were held to indicated potential levels for 250 ms. Red traces are for the first episodes, blue for the second and greens for the fifth episodes, respectively. Such voltage-dependent run-down does not occur when only the GIRK2 channel was expressed or coexpressed with the enzyme-defective Ci-VSP (C363S) (data not shown). B, plots of temporal changes of maximum Kir amplitudes from sets of data indicated in A. The curves were fitted with a single exponential. C, the averages of time constants for fitting the plots as in B from different cells. Time constants at 0 mV, 20 mV and 40 mV, were 3.51 ± 1.08 s (n = 7), 1.25 ± 0.17 s (n = 4), and 0.25 ± 0.04 s (n = 3), respectively.
Figure 4
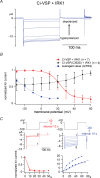
Changes in IRK1 (Kir2.1) channel activity report the enzymatic activity of Ci-VSP from 10 mV to 60 mV A, representative traces of the current of PtdIns(4,5)P2-sensitive IRK1 potassium channel coexpressed with Ci-VSP. Intervals were held to membrane potentials ranging from −30 mV to 60 mV. B, the dependence of relative amplitude of IRK1-derived currents on the interval voltages. IRK1 channel showed voltage-dependent decrease of the current from 10 to 60 mV (red), in a range more positive than that with GIRK2 (blue). IRK1 channels coexpressed with enzyme-defective Ci-VSP mutant (C363S) did not exhibit such changes in activity (black). Data of GIRK2 (dotted blue line) were adopted from our previous study (Murata et al. 2005). C, time-dependent change of Kir activities with depolarizing intervals to +50 mV (red) or with hyperpolarizing intervals to −60 mV (blue). The top panel indicates pulse protocols. In the middle panel, current traces evoked during repetitive test pulses to −100 mV are superimposed. Episode numbers are indicated for traces at the initial and last episode. Bottom panels show time-dependent plot of the Kir current. Values from four individual cells are shown by distinct symbols in both red and blue plots. The Kir amplitudes were standardized by those at zero time.
Figure 7
Induction of current decay of KCNQ2/3 channels occurs at lower membrane potential in D164N/D186N A, representative traces of KCNQ2/3 potassium currents in the presence of Ci-VSP (black traces), D151N (red) or D164N/D186N (blue). Current traces were elicited by a depolarizing step to between −20 mV and 60 mV. At a higher voltage level, endogenous outward current was activated and superimposed. B, the magnitude of the residual component of KCNQ2/3 current during a 4 s step pulse was normalized by the peak amplitude at each membrane potential level. Data were recorded from a single batch of oocytes. The proportion of residual current was calculated for each trace as the ratio of the minimum current amplitude following the peak timing against the maximum amplitude. When there is no decay, the maximum magnitude during a 4 s step pulse was divided by the amplitude at the end of the pulse. Expression level of Ci-VSPs was estimated by the total moved charges, _Q_off, of OFF-‘gating’ currents measured from another batch of oocytes that were microinjected with the same concentration of cRNA as for the measurement of KCNQ2/3 currents. _Q_off values (nC) were −51.5 ± 12.2 (Ci-VSP), −39.6 ± 8.2 (D151N), −45.8 ± 11.4 (D164N/D186N), respectively. The numbers of cells were 5, 4, 4 for Ci-VSP, D151N and D164N/D186N, respectively. Similar results of the current decay of KCNQ2/3 channel were obtained from two other experiments.
Figure 8
Scheme of operation of Ci-VSP A, depolarization induces upward charge displacement of the voltage sensor and this triggers activation of phosphatase. B, Ci-VSP dephosphorylates not only PtdIns(3,4,5)P3 but also PtdIns(4,5)P2.
Similar articles
- Coupling of the phosphatase activity of Ci-VSP to its voltage sensor activity over the entire range of voltage sensitivity.
Sakata S, Hossain MI, Okamura Y. Sakata S, et al. J Physiol. 2011 Jun 1;589(Pt 11):2687-705. doi: 10.1113/jphysiol.2011.208165. Epub 2011 Apr 4. J Physiol. 2011. PMID: 21486809 Free PMC article. - A voltage-sensing phosphatase, Ci-VSP, which shares sequence identity with PTEN, dephosphorylates phosphatidylinositol 4,5-bisphosphate.
Iwasaki H, Murata Y, Kim Y, Hossain MI, Worby CA, Dixon JE, McCormack T, Sasaki T, Okamura Y. Iwasaki H, et al. Proc Natl Acad Sci U S A. 2008 Jun 10;105(23):7970-5. doi: 10.1073/pnas.0803936105. Epub 2008 Jun 4. Proc Natl Acad Sci U S A. 2008. PMID: 18524949 Free PMC article. - 3' Phosphatase activity toward phosphatidylinositol 3,4-bisphosphate [PI(3,4)P2] by voltage-sensing phosphatase (VSP).
Kurokawa T, Takasuga S, Sakata S, Yamaguchi S, Horie S, Homma KJ, Sasaki T, Okamura Y. Kurokawa T, et al. Proc Natl Acad Sci U S A. 2012 Jun 19;109(25):10089-94. doi: 10.1073/pnas.1203799109. Epub 2012 May 29. Proc Natl Acad Sci U S A. 2012. PMID: 22645351 Free PMC article. - Electrifying phosphatases.
Horn R. Horn R. Sci STKE. 2005 Oct 25;2005(307):pe50. doi: 10.1126/stke.3072005pe50. Sci STKE. 2005. PMID: 16249403 Review. - Voltage-sensing phosphatase: its molecular relationship with PTEN.
Okamura Y, Dixon JE. Okamura Y, et al. Physiology (Bethesda). 2011 Feb;26(1):6-13. doi: 10.1152/physiol.00035.2010. Physiology (Bethesda). 2011. PMID: 21357898 Review.
Cited by
- A human phospholipid phosphatase activated by a transmembrane control module.
Halaszovich CR, Leitner MG, Mavrantoni A, Le A, Frezza L, Feuer A, Schreiber DN, Villalba-Galea CA, Oliver D. Halaszovich CR, et al. J Lipid Res. 2012 Nov;53(11):2266-74. doi: 10.1194/jlr.M026021. Epub 2012 Aug 15. J Lipid Res. 2012. PMID: 22896666 Free PMC article. - Role of K364 next to the active site cysteine in voltage-dependent phosphatase activity of Ci-VSP.
Paixao IC, Mizutani N, Matsuda M, Andriani RT, Kawai T, Nakagawa A, Okochi Y, Okamura Y. Paixao IC, et al. Biophys J. 2023 Jun 6;122(11):2267-2284. doi: 10.1016/j.bpj.2023.01.022. Epub 2023 Jan 20. Biophys J. 2023. PMID: 36680342 Free PMC article. - Triclosan is a KCNQ3 potassium channel activator.
De la Rosa V, Guzmán-Hernández ML, Carrillo E. De la Rosa V, et al. Pflugers Arch. 2022 Jul;474(7):721-732. doi: 10.1007/s00424-022-02692-w. Epub 2022 Apr 22. Pflugers Arch. 2022. PMID: 35459955 - Electrochemical coupling in the voltage-dependent phosphatase Ci-VSP.
Kohout SC, Bell SC, Liu L, Xu Q, Minor DL Jr, Isacoff EY. Kohout SC, et al. Nat Chem Biol. 2010 May;6(5):369-75. doi: 10.1038/nchembio.349. Epub 2010 Apr 4. Nat Chem Biol. 2010. PMID: 20364128 Free PMC article. - Crystal structure of the cytoplasmic phosphatase and tensin homolog (PTEN)-like region of Ciona intestinalis voltage-sensing phosphatase provides insight into substrate specificity and redox regulation of the phosphoinositide phosphatase activity.
Matsuda M, Takeshita K, Kurokawa T, Sakata S, Suzuki M, Yamashita E, Okamura Y, Nakagawa A. Matsuda M, et al. J Biol Chem. 2011 Jul 1;286(26):23368-77. doi: 10.1074/jbc.M110.214361. Epub 2011 May 4. J Biol Chem. 2011. PMID: 21543329 Free PMC article.
References
- Bezanilla F. The voltage sensor in voltage-dependent ion channels. Physiol Rev. 2000;80:555–592. - PubMed
- Fukuda M, Kojima T, Kabayama H, Mikoshiba K. Mutation of the pleckstrin homology domain of Bruton's tyrosine kinase in immunodeficiency impaired inositol 1,3,4,5-tetrakisphosphate binding capacity. J Biol Chem. 1996;271:30303–30306. - PubMed
Publication types
MeSH terms
Substances
LinkOut - more resources
Full Text Sources
Research Materials
Miscellaneous


