Differential regulation of epithelial and mesenchymal markers by deltaEF1 proteins in epithelial mesenchymal transition induced by TGF-beta - PubMed (original) (raw)
Differential regulation of epithelial and mesenchymal markers by deltaEF1 proteins in epithelial mesenchymal transition induced by TGF-beta
Takuya Shirakihara et al. Mol Biol Cell. 2007 Sep.
Abstract
Epithelial-mesenchymal transition (EMT), a crucial event in cancer progression and embryonic development, is induced by transforming growth factor (TGF)-beta in mouse mammary NMuMG epithelial cells. Id proteins have previously been reported to inhibit major features of TGF-beta-induced EMT. In this study, we show that expression of the deltaEF1 family proteins, deltaEF1 (ZEB1) and SIP1, is gradually increased by TGF-beta with expression profiles reciprocal to that of E-cadherin. SIP1 and deltaEF1 each dramatically down-regulated the transcription of E-cadherin in NMuMG cells through direct binding to the E-cadherin promoter. Silencing of the expression of both SIP1 and deltaEF1, but not either alone, completely abolished TGF-beta-induced E-cadherin repression. However, expression of mesenchymal markers, including fibronectin, N-cadherin, and vimentin, was not affected by knockdown of SIP1 and deltaEF1. TGF-beta-induced the expression of Ets1, which in turn activated deltaEF1 promoter activity. Moreover, up-regulation of SIP1 and deltaEF1 expression by TGF-beta was suppressed by knockdown of Ets1 expression. In addition, Id2 suppressed the TGF-beta- and Ets1-induced up-regulation of deltaEF1. Taken together, these findings suggest that the deltaEF1 family proteins, SIP1 and deltaEF1, are necessary, but not sufficient, for TGF-beta-induced EMT and that Ets1 induced by TGF-beta may function as an upstream transcriptional regulator of SIP1 and deltaEF1.
Figures
Figure 1.
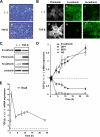
Induction of EMT by TGF-β in NMuMG cells. (A) Phase-contrast images of cells treated for 24 h without (a) or with 1 ng/ml TGF-β (b). (B) Immunofluorescence images of cells showing the localization and organization of the indicated markers after 24 h of treatment without (a–c) or with (d–f) 1 ng/ml TGF-β. Reorganization of the actin cytoskeleton determined by TRITC-phalloidin staining (a and d), E-cadherin staining (b and e), and N-cadherin staining (c and f) are shown. (C) Endogenous levels of E-cadherin, fibronectin, and N-cadherin proteins were detected by immunoblotting at 24 h after treatment with or without 1 ng/ml TGF-β. α-tubulin levels were monitored as a loading control for whole-cell extracts. (D and E) Induction of target genes, including E-cadherin, SIP1, δEF1, Id2 (D), and Snail (E) was examined in cells treated with TGF-β for the indicated periods by semiquantitative RT-PCR analyses. Ratios of mRNA levels in TGF-β–treated cells to those in nontreated cells are shown. Values were normalized to the amount of house keeping GAPDH mRNA.
Figure 2.
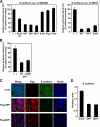
Down-regulation of E-cadherin expression by exogenous SIP1 or δEF1. (A) NMuMG cells (left) were cotransfected with mouse E-cadherin promoter-reporter construct (E-cadherin-Luc.) in combination with 0.5 μg of ALK5TD or 0.7 μg of E47-, SIP1-, δEF1-, Snail-, Slug-, and Twist-expressing plasmids. MDCK cells (right) were cotransfected with E-cadherin-Luc with 0.7 μg of E47-, SIP1-, and Snail-expressing plasmids. At 24 h after transfection, the cells were harvested and assayed for luciferase activity. (B) NMuMG cells were transiently cotransfected with the E-cadherin promoter-reporter plasmid and with wild-type SIP1 (WT) or SIP1-ΔSBD (ΔSBD). Luciferase activity was determined as in A. (C) NMuMG cells infected with mock, Flag-SIP1, and Flag-δEF1 adenoviruses were immunostained with anti-Flag M2 (second from left side) and anti-E-cadherin antibodies (second from right side) and stained with TOTO3 to detect nuclei (right side). (D) Levels of expression of E-cadherin mRNA in NMuMG cells infected with mock, SIP1, or δEF1 adenoviruses were determined by quantitative RT-PCR. Values were normalized to GAPDH mRNA.
Figure 3.
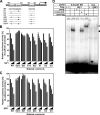
E-box1 and E-box2 in mouse E-cadherin promoter are required for SIP1- and δEF1-dependent repression of E-cadherin. (A) Schematic diagram of the mouse wild-type E-cadherin-luciferase construct (WT) and its mutants used in luciferase assays. (B and C) SIP1 or δEF1 expression plasmids at concentrations of 0, 0.1, 0.25, and 0.5 μg were cotransfected with mouse wild-type E-cadherin luciferase construct (WT) and its mutants in NMuMG cells. At 24 h after transfection, luciferase activity was determined as described in Materials and Methods. (D) Gel shift assay was performed with probes resembling the E-box2/1 of mouse E-cadherin gene (E-box2/1 WT) or its mutant (mut.). Nuclear extracts from NMuMG cells overexpressing Flag-SIP1 were incubated with the indicated probes. SIP1 binding to E-box2/1 was competed with a 50-fold molar excess of unlabeled wild-type or mutant probes. Black arrowhead indicates the position of the complex of SIP1. The supershifted complex (white arrowhead) is observed upon addition of the anti-Flag M2 antibody to the binding reaction.
Figure 4.
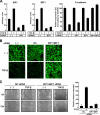
Double knockdown of SIP1 and δEF1 relieves TGF-β–induced E-cadherin regulation. (A) NMuMG cells transfected with SIP1 siRNA, δEF1 siRNA, or both siRNAs (SIP1+δEF1) were stimulated with 1.0 ng/ml TGF-β for 24 h and examined by semiquantitative RT-PCR analyses for SIP1 (left), δEF1 (center), and E-cadherin levels (right). Values were normalized to the amount of GAPDH mRNA. (B) NMuMG cells transfected without or with control (NC) or both SIP1 and δEF1 (SIP1+δEF1) siRNAs were stimulated with 1.0 ng/ml TGF-β for 24 h and subjected to immunofluorescence staining for E-cadherin. (C) Migratory behaviors of knocked-down cells in the absence or presence of TGF-β were determined by a wound assay (left) and quantified as described in Materials and Methods (right). NC, control siRNA.
Figure 5.
Changes in mesenchymal markers in SIP1 and δEF1 knocked-down cells. (A) NMuMG cells transfected with both SIP1 and δEF1 (SIP1+δEF1) siRNAs were stimulated with 2.5 ng/ml TGF-β for 24 h and examined by semiquantitative RT-PCR analyses for levels of E-cadherin (left), fibronectin (center), and N-cadherin (right). Values were normalized to the amount of GAPDH mRNA. (B) NMuMG cells transfected with control (NC) or SIP1 and δEF1 (SIP1+δEF1) siRNAs were stimulated with TGF-β for 24 h and subjected to immunoblot analysis using anti-δEF1, E-cadherin, fibronectin, and N-cadherin antibodies. α-tubulin levels were monitored as a loading control for whole-cell extracts. (C) After being transfected without or with control (NC) or both SIP1 and δEF1 (SIP1+δEF1) siRNAs, cells were grown in the absence or presence of 1 ng/ml TGF-β, followed by direct staining of the actin cytoskeleton using TRICT-phalloidin. NC, control siRNA.
Figure 6.
Requirement of de novo protein synthesis for induction of SIP1 by TGF-β. NMuMG cells pretreated with 5 μM of cycloheximide (CHX) for 1 h were stimulated with 1 ng/ml TGF-β for 12 h. RNAs were extracted and analyzed by semiquantitative RT-PCR to determine levels of endogenous Smad7, Snail, and SIP1. Values were normalized to the amount of GAPDH mRNA.
Figure 7.
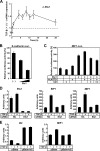
Involvement of Ets1 in TGF-β–induced δEF1 family gene expression. (A) RNAs were extracted from NMuMG cells treated with 1 ng/ml TGF-β for the indicated periods and analyzed for expression of Ets mRNA by semiquantitative RT-PCR. Ratios of the Ets1 mRNA level in TGF-β–treated cells to those in nontreated cells are shown. Values were normalized to the amount of GAPDH mRNA. (B) Cells were cotransfected with mouse E-cadherin promoter-luciferase plasmid (E-cadherin-Luc) and 0.1 or 0.3 μg of Ets1 plasmid, incubated for 24 h and measured for luciferase activity. (C) Cells were cotransfected with δEF1 promoter-luciferase plasmid (δEF1-Luc), and the indicated plasmids were incubated for 24 h and measured for luciferase activity. Id2 expression plasmids were used at concentrations of 0.1 μg (+) and 0.5 μg (++). (D) Cells transfected with siRNA against mouse Ets1 were incubated for 8 h, treated with 1 ng/ml TGF-β for another 24 h, and then analyzed by semiquantitative RT-PCR to determine levels of endogenous Ets1 (left), SIP1 (center), and δEF1 (right). Values were normalized to the amount of housekeeping β-glucuronidase mRNA. NC, control siRNA. (E) NMuMG cells infected with pBabe or pBabe-Id2 were stimulated with 1 ng/ml TGF-β. After 12 h, levels of Id2 and endogenous δEF1 were measured by semiquantitative RT-PCR. Values were normalized to the amount of β-glucuronidase mRNA.
Similar articles
- TGF-β drives epithelial-mesenchymal transition through δEF1-mediated downregulation of ESRP.
Horiguchi K, Sakamoto K, Koinuma D, Semba K, Inoue A, Inoue S, Fujii H, Yamaguchi A, Miyazawa K, Miyazono K, Saitoh M. Horiguchi K, et al. Oncogene. 2012 Jun 28;31(26):3190-201. doi: 10.1038/onc.2011.493. Epub 2011 Oct 31. Oncogene. 2012. PMID: 22037216 Free PMC article. - A role for Id in the regulation of TGF-beta-induced epithelial-mesenchymal transdifferentiation.
Kondo M, Cubillo E, Tobiume K, Shirakihara T, Fukuda N, Suzuki H, Shimizu K, Takehara K, Cano A, Saitoh M, Miyazono K. Kondo M, et al. Cell Death Differ. 2004 Oct;11(10):1092-101. doi: 10.1038/sj.cdd.4401467. Cell Death Differ. 2004. PMID: 15181457 - SIP1 (Smad interacting protein 1) and deltaEF1 (delta-crystallin enhancer binding factor) are structurally similar transcriptional repressors.
van Grunsven LA, Schellens A, Huylebroeck D, Verschueren K. van Grunsven LA, et al. J Bone Joint Surg Am. 2001;83-A Suppl 1(Pt 1):S40-7. J Bone Joint Surg Am. 2001. PMID: 11263664 Review. - Transforming growth factor-beta signaling in epithelial-mesenchymal transition and progression of cancer.
Miyazono K. Miyazono K. Proc Jpn Acad Ser B Phys Biol Sci. 2009;85(8):314-23. doi: 10.2183/pjab.85.314. Proc Jpn Acad Ser B Phys Biol Sci. 2009. PMID: 19838011 Free PMC article. Review.
Cited by
- Zeb1 promotes corneal neovascularization by regulation of vascular endothelial cell proliferation.
Jin L, Zhang Y, Liang W, Lu X, Piri N, Wang W, Kaplan HJ, Dean DC, Zhang L, Liu Y. Jin L, et al. Commun Biol. 2020 Jul 3;3(1):349. doi: 10.1038/s42003-020-1069-z. Commun Biol. 2020. PMID: 32620870 Free PMC article. - ZEB1 imposes a temporary stage-dependent inhibition of muscle gene expression and differentiation via CtBP-mediated transcriptional repression.
Siles L, Sánchez-Tilló E, Lim JW, Darling DS, Kroll KL, Postigo A. Siles L, et al. Mol Cell Biol. 2013 Apr;33(7):1368-82. doi: 10.1128/MCB.01259-12. Epub 2013 Jan 22. Mol Cell Biol. 2013. PMID: 23339872 Free PMC article. - Epithelial-to-mesenchymal transition induced by TGF-β1 is mediated by Blimp-1-dependent repression of BMP-5.
Romagnoli M, Belguise K, Yu Z, Wang X, Landesman-Bollag E, Seldin DC, Chalbos D, Barillé-Nion S, Jézéquel P, Seldin ML, Sonenshein GE. Romagnoli M, et al. Cancer Res. 2012 Dec 1;72(23):6268-78. doi: 10.1158/0008-5472.CAN-12-2270. Epub 2012 Oct 10. Cancer Res. 2012. PMID: 23054396 Free PMC article. - Inhibitory effects of the transcription factor Ets-1 on the expression of type I collagen in TGF-β1-stimulated renal epithelial cells.
Okano K, Hibi A, Miyaoka T, Inoue T, Sugimoto H, Tsuchiya K, Akiba T, Nitta K. Okano K, et al. Mol Cell Biochem. 2012 Oct;369(1-2):247-54. doi: 10.1007/s11010-012-1388-6. Epub 2012 Jul 25. Mol Cell Biochem. 2012. PMID: 22829018 - From shape-shifting embryonic cells to oncology: The fascinating history of epithelial mesenchymal transition.
Akhurst RJ. Akhurst RJ. Semin Cancer Biol. 2023 Nov;96:100-114. doi: 10.1016/j.semcancer.2023.10.003. Epub 2023 Oct 16. Semin Cancer Biol. 2023. PMID: 37852342 Free PMC article. Review.
References
- Akhurst R. J., Derynck R. TGF-β signaling in cancer—a double-edged sword. Trends Cell Biol. 2001;11:S44–S51. - PubMed
- Azuma H., et al. Effect of Smad7 expression on metastasis of mouse mammary carcinoma JygMC(A) cells. J. Natl. Cancer Inst. 2005;97:1734–1746. - PubMed
- Barrallo-Gimeno A., Nieto M. A. The Snail genes as inducers of cell movement and survival: implications in development and cancer. Development. 2005;132:3151–3161. - PubMed
Publication types
MeSH terms
Substances
LinkOut - more resources
Full Text Sources
Molecular Biology Databases
Research Materials
Miscellaneous
