Analysis of turnover and translation regulatory RNA-binding protein expression through binding to cognate mRNAs - PubMed (original) (raw)
Analysis of turnover and translation regulatory RNA-binding protein expression through binding to cognate mRNAs
Rudolf Pullmann Jr et al. Mol Cell Biol. 2007 Sep.
Abstract
RNA-binding proteins (RBPs) that associate with specific mRNA sequences and function as mRNA turnover and translation regulatory (TTR) RBPs are emerging as pivotal posttranscriptional regulators of gene expression. However, little is known about the mechanisms that govern the expression of TTR-RBPs. Here, we employed human cervical carcinoma HeLa cells to test the hypothesis that TTR-RBP expression is influenced posttranscriptionally by TTR-RBPs themselves. Systematic testing of the TTR-RBPs AUF1, HuR, KSRP, NF90, TIA-1, and TIAR led to three key discoveries. First, each TTR-RBP was found to associate with its cognate mRNA and with several other TTR-RBP-encoding mRNAs, as determined by testing both endogenous and biotinylated transcripts. Second, silencing of individual TTR-RBPs influenced the expression of other TTR-RBPs at the mRNA and/or protein level. Third, further analysis of two specific ribonucleoprotein (RNP) complexes revealed that TIA-1 expression was controlled via HuR-enhanced mRNA stabilization and TIAR-repressed translation. Together, our findings underscore the notion that TTR-RBP expression is controlled, at least in part, at the posttranscriptional level through a complex circuitry of self- and cross-regulatory RNP interactions.
Figures
FIG. 1.
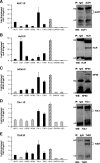
Detection of TTR-RBP mRNAs in immunoprecipitated TTR-RBP RNP complexes. Whole-cell lysates prepared from untreated HeLa cells were used for IP analysis using antibodies that recognized either AUF1 (A), HuR (B), NF90 (C), TIA-1 (D), TIAR (E), or species-specific control IgG in each case. In the graphs, RNA was extracted from the RNP complexes present in each IP sample, and the levels of the TTR-RBP mRNAs shown (those encoding AUF1, HuR, KSRP, NF90, TIA-1, and TIAR), mRNAs that were known targets of each TTR-RBP and were included as positive controls (those encoding Gadd45 [GADD], prothymosin α [ProTα], thymidylate synthase [TS], cytochrome c [CytoC], and c-Myc [MYC]) (hatched bars), as well as those of housekeeping GAPDH and UBC mRNAs (low-level contaminating transcripts that served to monitor the equality of sample input), were detected after RT followed by real-time qPCR amplification. The resulting data are represented as enrichment of each mRNA in the specific TTR-RBP IP samples compared with its abundance in control IgG IP samples. The TTR-RBP mRNA enrichment levels in each IP were adjusted to the levels of GAPDH mRNA enrichment in each IP (the latter values were routinely close to 1). TTR-RBP mRNAs showing twofold or higher enrichment in TTR-RBP IPs relative to IgG IPs are shown as black bars; all others (no enrichment detected) are represented by gray bars. The data shown are the means and standard errors of the mean of four to six independent experiments. HC, heavy immunoglobulin chain; LC, light immunoglobulin chain. In the IP plus Western blots, for each TTR-RBP, the quality of the IP was monitored by subsequent Western blot (WB) analysis of the IP samples.
FIG. 2.
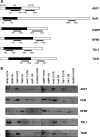
Binding of biotinylated TTR-RBP RNAs to TTR-RBPs. (A) Schematic of TTR-RBP mRNAs, depicting in black rectangles the CRs and in white flanking rectangles the 5′ UTR and 3′ UTR of each TTR-RBP mRNA. The specific fragments used as templates for the synthesis of biotinylated RNAs are indicated by underlining, and the nucleotide positions amplified by PCR are shown. (B) Biotin pull-down analysis of complexes formed in vitro using biotinylated TTR-RBP mRNA segments (shown in panel A) and endogenous TTR-RBPs present in HeLa whole-cell lysates, as detected by Western blot analysis. A biotinylated RNA spanning the GAPDH 3′ UTR (which is not a target of TTR-RBPs) was included as a negative control. The data are representative of three to six independent experiments.
FIG. 3.
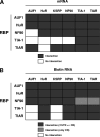
Compiled results from TTR-RBP binding to endogenous and biotinylated TTR-RBP transcripts. Shown are schematic representations of the results from the RNP IP analysis in Fig. 1 (A) and from the biotin pull-down analysis in Fig. 2 (B).
FIG. 4.
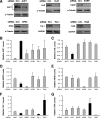
Effects of TTR-RBP silencing on the expression of TTR-RBPs. (A) Forty-eight hours after transfection of HeLa cells with siRNAs specifically targeting each of the TTR-RBPs indicated (or control [Ctrl.] siRNAs), the levels of the corresponding TTR-RBPs were tested by Western blot analysis; the membranes were reprobed to test the levels of the housekeeping proteins GAPDH and α-tubulin in order to monitor loading differences. In cultures with silenced TTR-RBPs (processed as described for panel A), the levels of AUF1 (B), HuR (C), KSRP (D), NF90 (E), TIA-1 (F), and TIAR (G) were assessed by Western blot analysis, quantified by densitometric scanning, normalized to loading controls (GAPDH or α-tubulin levels), and represented as “relative TTR-RBP levels” compared with the levels seen in control siRNA-transfected cultures. Black bars, TTR-RBPs showing twofold or higher levels, as well as TTR-RBPs showing 50% or lower levels, in TTR-RBP-silenced cultures compared with control silenced cells; gray bars, all other TTR-RBPs. The data represent the means and standard errors of the mean of four independent experiments.
FIG. 5.
Analysis of the levels of TTR-RBPs. (A) Western blot analysis of the abundance of proteins corresponding to the TTR-RBPs shown in Fig. 4 (10 μg of whole-cell HeLa lysates per lane). Ctrl., control. (B) Using uterine sarcoma MES-SA/Dx5 cells that were transfected as described for HeLa cells in the legend to Fig. 4A, whole-cell lysates were tested for expression of the TTR-RBPs shown. The levels of the control proteins β-actin and GAPDH were also tested. The data in panels A and B are representative of three independent experiments.
FIG. 6.
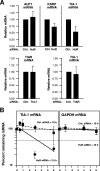
Analysis of the effects of TTR-RBP silencing on specific TTR-RBP target mRNAs and proteins. (A) Total RNA was extracted from HeLa cell cultures that were processed as described in the legend to Fig. 4A, and the levels of AUF1, KSRP, and TIA-1 mRNAs in HuR-silenced cells (left), TIAR mRNA in TIA-1-silenced cells (center), and TIA-1 mRNA in TIAR-silenced cells (right) were tested by RT-qPCR analysis. The data represent the means and standard errors of the mean from three independent experiments. (B) The stability of the TIA-1 mRNA was measured in HeLa cells expressing either normal or reduced levels of HuR (48 h after transfection with either control (Ctrl.) siRNA or HuR siRNA, respectively) by incubating cells with actinomycin D to block de novo transcription by RNA polymerase II. At the times shown following the addition of actinomycin D, total RNA was extracted and the levels of TIA-1 mRNA and housekeeping control GAPDH mRNA were measured by RT-qPCR. After normalization of each mRNA to the level of 18S rRNA in each sample, mRNA clearance was visualized by comparing the levels of remaining mRNA to the levels of mRNA before the addition of actinomycin D (time zero). The mRNA half-life was calculated as the time required to reach one-half of its initial mRNA abundance.
FIG. 7.
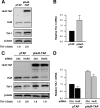
Effects of HuR on TIA-1 mRNA and protein expression. (A) HeLa cells were transfected with a plasmid expressing a TAP-tagged HuR (pHuR-TAP) or the control pTAP vector. Forty-eight hours after transfection, the levels of endogenous HuR, HuR-TAP, and TIA-1 (as well as loading control β-actin) were tested by Western blot analysis. (B) Total RNA was prepared from HeLa cells that had been transfected as described in the legend to Fig. 6A; the levels of TIA-1 mRNA were measured by RT-qPCR, normalized to the levels of housekeeping control GAPDH mRNA, and represented as the relative TIA-1 mRNA levels in pHuR-TAP-transfected cells compared with pTAP-transfected cells. (C) HeLa cells were simultaneously transfected with siRNAs (an siRNA targeting the HuR 3′ UTR [HuR3] or control [Ctrl.] siRNA) and with plasmid DNA (pHuR-TAP or pTAP). Forty-eight hours later, the levels of endogenous HuR, HuR-TAP, TIA-1, and loading control β-actin were assessed by Western blot analysis. (D) TIA-1 mRNA levels in cells that were transfected as described in the legend to Fig. 6C were measured by RT-qPCR, normalized to the levels of housekeeping control GAPDH mRNA, and represented as the relative TIA-1 mRNA levels in pHuR-TAP-transfected cells compared with pTAP- and control siRNA-transfected cells. Panels A and C display representative results from three independent experiments; panels B and D show the mean values and standard errors of the mean from three independent experiments.
FIG. 8.
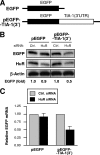
TIA-1 3′ UTR reporter analysis after HuR silencing. (A) Schematic of plasmids pEGFP and pEGF-TIA-1(3′UTR), which were constructed in order to investigate the influence of the TIA-1 3′ UTR on the expression of the heterologous reporter EGFP. (B) HeLa cells were cotransfected with 2 μg of plasmid DNA [either pEGFP or pEGFP-TIA-1(3′)] and with 100 nM of siRNA (either control [Ctrl.] siRNA or HuR siRNA); 48 h later, protein lysates were prepared from each transfection group and the levels of EGFP, HuR, and loading control β-actin were assessed by Western blot analysis. (C) The levels of EGFP and EGFP-TIA-1(3′ UTR) mRNAs in cells that were transfected as described in the legend to Fig. 7B were measured by RT-qPCR analysis, using 18S rRNA for normalization. The data represent the means and standard errors of the mean from three independent experiments.
FIG. 9.
Effects of TIAR on TIA-1 expression. (A) Forty-eight hours after transfection of HeLa cells with either an siRNA targeting the TIAR CR (TIAR siRNA) or a control (Ctrl.) siRNA, the levels of endogenous TIAR and loading control α-tubulin were assessed by Western blot analysis (left). (Right) In the same cultures, the levels of nascent TIA-1 and control GAPDH were measured following incubation of cells with
l
-[35S]methionine and
l
-[35S]cysteine for 15 min; following IP using either anti-TIA-1 (left) or anti-GAPDH (right) antibodies, along with control IgG (center), the incorporation of radiolabeled amino acids into newly synthesized TIA-1 and GAPDH polypeptides (arrowheads) was visualized after SDS-PAGE and transfer and was quantified using a phosphorimager; the change in de novo-translated TIA-1 is shown. (B) HeLa cells were simultaneously transfected with siRNAs (an siRNA targeting the TIAR 3′ UTR [TIAR3] or control siRNA) and with plasmid DNA (pMT2-TIAR or pMT2). Forty-eight hours later, the levels of endogenous TIAR, TIA-1, and loading control β-actin were assessed by Western blot analysis. The differences in TIA-1 expression levels are indicated. (C) TIA-1 mRNA levels in cells that were transfected as described in the legend to panel B were measured by RT-qPCR, normalized to the levels of housekeeping control GAPDH mRNA, and represented as the relative TIA-1 mRNA levels in pMT2-TIAR-transfected cells compared with pMT2- and control siRNA-transfected cells. Panels A and B display representative results from three independent experiments; panel C shows the mean values and standard errors of the mean from three independent experiments.
FIG. 10.
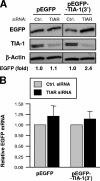
TIA-1 3′ UTR reporter analysis after TIAR silencing. (A) Two micrograms of plasmids pEGFP and pEGFP-TIA-1(3′UTR), depicted in Fig. 8A, were cotransfected with 100 nM of siRNA (either control [Ctrl.] siRNA or TIAR siRNA); 48 h later, protein lysates were prepared from each transfection group and the levels of EGFP, TIA-1, and loading control β-actin were assessed by Western blot analysis. (B) The levels of EGFP and EGFP-TIA-1(3′) mRNAs in cells that were transfected as described in the legend to panel A were measured by RT-qPCR analysis, using 18S rRNA for normalization. The data represent the means and standard errors of the mean from three independent experiments.
Similar articles
- Translational control of cytochrome c by RNA-binding proteins TIA-1 and HuR.
Kawai T, Lal A, Yang X, Galban S, Mazan-Mamczarz K, Gorospe M. Kawai T, et al. Mol Cell Biol. 2006 Apr;26(8):3295-307. doi: 10.1128/MCB.26.8.3295-3307.2006. Mol Cell Biol. 2006. PMID: 16581801 Free PMC article. - General RBP expression in human tissues as a function of age.
Masuda K, Kuwano Y, Nishida K, Rokutan K. Masuda K, et al. Ageing Res Rev. 2012 Sep;11(4):423-31. doi: 10.1016/j.arr.2012.01.005. Epub 2012 Feb 4. Ageing Res Rev. 2012. PMID: 22326651 Review. - Post-transcriptional control of the MCT-1-associated protein DENR/DRP by RNA-binding protein AUF1.
Mazan-Mamczarz K, Gartenhaus RB. Mazan-Mamczarz K, et al. Cancer Genomics Proteomics. 2007 May-Jun;4(3):233-9. Cancer Genomics Proteomics. 2007. PMID: 17878526 - Tissue- and age-dependent expression of RNA-binding proteins that influence mRNA turnover and translation.
Masuda K, Marasa B, Martindale JL, Halushka MK, Gorospe M. Masuda K, et al. Aging (Albany NY). 2009 Jul 26;1(8):681-98. doi: 10.18632/aging.100073. Aging (Albany NY). 2009. PMID: 20157551 Free PMC article. - HuR and other turnover- and translation-regulatory RNA-binding proteins: implications for the kidney.
Pullmann R Jr, Rabb H. Pullmann R Jr, et al. Am J Physiol Renal Physiol. 2014 Mar 15;306(6):F569-76. doi: 10.1152/ajprenal.00270.2013. Epub 2014 Jan 15. Am J Physiol Renal Physiol. 2014. PMID: 24431206 Review.
Cited by
- The p38/MK2-driven exchange between tristetraprolin and HuR regulates AU-rich element-dependent translation.
Tiedje C, Ronkina N, Tehrani M, Dhamija S, Laass K, Holtmann H, Kotlyarov A, Gaestel M. Tiedje C, et al. PLoS Genet. 2012 Sep;8(9):e1002977. doi: 10.1371/journal.pgen.1002977. Epub 2012 Sep 27. PLoS Genet. 2012. PMID: 23028373 Free PMC article. - The Role of KH-Type Splicing Regulatory Protein (KSRP) for Immune Functions and Tumorigenesis.
Palzer KA, Bolduan V, Käfer R, Kleinert H, Bros M, Pautz A. Palzer KA, et al. Cells. 2022 Apr 28;11(9):1482. doi: 10.3390/cells11091482. Cells. 2022. PMID: 35563788 Free PMC article. Review. - T-Cell Intracellular Antigen 1-Like Protein in Physiology and Pathology.
Velasco BR, Izquierdo JM. Velasco BR, et al. Int J Mol Sci. 2022 Jul 16;23(14):7836. doi: 10.3390/ijms23147836. Int J Mol Sci. 2022. PMID: 35887183 Free PMC article. Review. - Conditional knockout of the RNA-binding protein HuR in CD4⁺ T cells reveals a gene dosage effect on cytokine production.
Gubin MM, Techasintana P, Magee JD, Dahm GM, Calaluce R, Martindale JL, Whitney MS, Franklin CL, Besch-Williford C, Hollingsworth JW, Abdelmohsen K, Gorospe M, Atasoy U. Gubin MM, et al. Mol Med. 2014 Mar 20;20(1):93-108. doi: 10.2119/molmed.2013.00127. Mol Med. 2014. PMID: 24477678 Free PMC article. - The ribonome: a dominant force in co-ordinating gene expression.
Mansfield KD, Keene JD. Mansfield KD, et al. Biol Cell. 2009 Mar;101(3):169-81. doi: 10.1042/BC20080055. Biol Cell. 2009. PMID: 19152504 Free PMC article. Review.
References
- Anderson, P., and N. Kedersha. 2002. Stressful initiations. J. Cell Sci. 115:3227-3234. - PubMed
Publication types
MeSH terms
Substances
LinkOut - more resources
Full Text Sources
Other Literature Sources
Research Materials
Miscellaneous
