Comparable potency of IFNalpha2 and IFNbeta on immediate JAK/STAT activation but differential down-regulation of IFNAR2 - PubMed (original) (raw)
Comparable potency of IFNalpha2 and IFNbeta on immediate JAK/STAT activation but differential down-regulation of IFNAR2
Zrinka Marijanovic et al. Biochem J. 2007.
Abstract
Type I IFNs (interferons) (IFNalpha/beta) form a family of related cytokines that control a variety of cellular functions through binding to a receptor composed of IFNAR (IFNalpha receptor subunit) 1 and 2. Among type I IFNs, the alpha2 and beta subtypes exhibit a large difference in their binding affinities to IFNAR1, and it was suggested that high concentrations of IFNAR1 may compensate for its low intrinsic binding affinity for IFNalpha2. We tested whether receptor-proximal signalling events are sensitive to IFNAR1 surface concentration by investigating the relationship between relative IFNAR1/IFNAR2 surface levels and IFNalpha2 and IFNbeta signalling potencies in several cell lines. For this, we monitored the activation profile of JAK (Janus kinase)/STAT (signal transducer and activator of transcription) proteins, measured basal and ligand-induced surface decay of each receptor subunit and tested the effect of variable IFNAR1 levels on IFNalpha2 signalling potency. Our data show that the cell-surface IFNAR1 level is indeed a limiting factor for assembly of the functional complex, but an increased concentration of it does not translate into an IFNalpha/beta differential JAK/STAT signalling nor does it change the dynamics of the engaged receptor. Importantly, however, our data highlight a differential effect upon routing of IFNAR2. Following binding of IFNalpha2, IFNAR2 is internalized, but, instead of being routed towards degradation as it is when complexed to IFNbeta, it recycles back to the cell surface. These observations suggest strongly that the stability and the intracellular lifetime of the ternary complex account for the differential control of IFNAR2. Moreover, the present study opens up the attractive possibility that endosomal-initiated signalling may contribute to IFNalpha/beta differential bioactivities.
Figures
Figure 1. Surface levels of IFNAR1 and IFNAR2 and profiles of IFN-induced JAK/STAT phosphorylation in four cell lines
(A) Steady-state levels of IFNAR1 and IFNAR2 at the cell surface of the indicated cell lines were measured by flow cytometry. 293T, HEK-293T. (B and C) Kinetics of IFNα- and IFNβ-induced Tyk2 and STAT1/2/3 phosphorylation in Daudi and Jurkat cells. Cells were incubated with 500 pM IFNα2 or IFNβ for the indicated time. Total lysates (40 μg) were resolved by SDS/PAGE, and the levels of phosphorylated or total Tyk2 and STAT1/2/3 were analysed by Western blotting. (D) Dose–response profiles of Tyk2 and STAT1/2/3 phosphorylation (-P) after IFNα2 or IFNβ treatment of Daudi and Jurkat cells. Cells were treated with the indicated doses (from 2.5 to 500 pM) of IFNα2 or IFNβ for 30 min. Lysates (40 μg) were analysed as described in (A). Results are representative of at least three different experiments.
Figure 2. IFNα2- and IFNβ-induced phosphorylation profiles in WISH cells
(A) Kinetics of Tyk2 and STAT1/2/3 phosphorylation in WISH cells treated with 500 pM IFNα2 or IFNβ for the indicated times. (B) Dose–response profiles of Tyk2 and STAT1/2/3 phosphorylation (-P) in WISH cells treated for 15 min with IFNα2 or IFNβ. Lysates (40 μg) were analysed by Western blotting. Results are representative of at least three different experiments.
Figure 3. Levels of IFNAR1 and IFNAR2 and IFNα2-induced phosphorylation profiles in WISH-derived clones
(A) Surface IFNAR1 and IFNAR2 levels in stable WISH clones measured by flow cytometry. Three stable clones were derived from WISH parental cells: one depleted of endogenous IFNAR1 (CPO2), one overexpressing IFNAR1 (R16), and one expressing IFNAR1 as in parental cells (R23). (B) Total IFNAR1 content and IFNα-induced JAK/STAT phosphorylation (-P) in CPO2, R23 and R16 clones. Cells were incubated with 500 pM IFNα2 for the indicated time. Lysates (40 μg) were analysed by Western blotting. Results are representative of at least three different experiments. The lower band visible in the R16 samples represents a 95 kDa incompletely processed IFNAR1 species which accumulates when the protein is overexpressed [15].
Figure 4. Dose–response profiles of IFNα2-induced JAK/STAT phosphorylation in WISH-derived clones
(A) CPO2 and R23 cells were treated with increasing doses of IFNα2 for 15 min. Note the maximal dose (2500 pM) added on CPO2 cells. (B) R23 and R16 cells were treated with IFNα2 (from 1 to 100 pM) for 15 min. Total lysates (40 μg) were resolved by SDS/PAGE and levels of phosphorylated (-P) Tyk2, JAK1 and STAT1/2/3 were analysed by Western blotting. The arrowhead points to a band, identified as phospho-Tyk2, which cross-reacts with anti-phospho-JAK1 Abs.
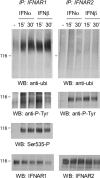
Figure 5. Ligand-induced post-translational modifications of IFNAR1 and IFNAR2
Daudi cells were treated with 500 pM IFNα2 or IFNβ for the indicated times. Total lysates (5 mg) were used to immunoprecipitate endogenous IFNAR1 and IFNAR2. Immunoprecipitates were resolved by SDS/PAGE, and the extent of ubiquitination of the receptors was analysed using anti-ubiquitin (ubi) Abs (top panels). Note the shift in migration of IFNAR1 due to induced ubiquitination. The left-hand membrane was stripped and reprobed with anti-phosphotyrosine 4G10 mAb, phospho-Ser535-IFNAR1-specific Abs and anti-IFNAR1 mAb, as indicated. The right-hand membrane was stripped and reprobed with anti-phosphotyrosine 4G10 mAb and anti-IFNAR2 mAb, as indicated. Migration of the 116 kDa marker is indicated on the left (116). Results are representative of at least three different experiments. IP, immunoprecipitation; WB, Western blot.
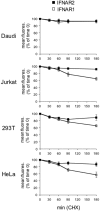
Figure 6. Basal decay of surface IFNAR1 and IFNAR2
Surface stability of IFNAR1 and IFNAR2 in unstimulated cells. Decay of IFNAR1 (□) and IFNAR2 (■) from the surface of Daudi, Jurkat, HEK-293T (293T) and HeLa cells treated with CHX was measured by flow cytometry. Results are percentages of the mean fluorescence (fluores.) at zero time (means±S.E.M. for four experiments).
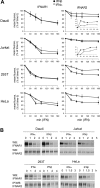
Figure 7. Ligand-induced down-regulation of IFNAR1 and IFNAR2
(A) IFNAR1 (left-hand panels) and IFNAR2 (right-hand panels) decay from the cell surface was measured by flow cytometry in cells treated with CHX and 500 pM IFNα2 (○) or IFNβ (●) for the indicated times. Results are percentages of the mean fluorescence (fluores.) at zero time (means±S.E.M. for at least three different experiments). Insets show the difference between mean fluorescence values measured in untreated and IFN-treated cells. 293T, HEK-293T. (B) Daudi, Jurkat, HEK-293T (293T) and HeLa cells were treated with 500 pM IFNα2 or IFNβ for the indicated times. Total lysates (40 μg) were resolved by SDS/PAGE, and levels of IFNAR1 and IFNAR2 were analysed by Western blotting (WB) using corresponding Abs. IP, immunoprecipitation.
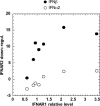
Figure 8. Ligand-induced down-regulation of IFNAR2 in HEK-293T cells expressing different levels of IFNAR1
HEK-293T cells were transiently co-transfected with EGFP and either an IFNAR1-silencing vector or an IFNAR1-expression vector. An aliquot of the transfected cells was monitored for EGFP and IFNAR1 levels. In parallel, cells were treated with 200 pM IFNα2 or IFNβ for 2 h, or left untreated, and levels of IFNAR2 were measured in chosen EGFP-positive subpopulations. IFNAR1 relative level (_x_-axis) represents the amount of surface IFNAR1 in transfected cells relative to endogenous IFNAR1 (marked as 1) in untreated cells. The extent of IFNAR2 down-regulation (_y_-axis) is expressed as the difference in the geometric mean of IFNAR2-specific fluorescence between untreated cells and cells treated with IFNα2 (○) or IFNβ (●).
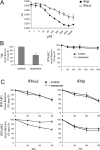
Figure 9. IFNα2-induced recycling of IFNAR2 in HeLa cells
(A) IFN-induced antiproliferative effect in HeLa cells. Cells were either left untreated or treated with the indicated concentrations of IFNα2 (○) or IFNβ (●) for 72 h. Cell density was monitored by Crystal Violet staining as described in the Experimental section. The mean absorbance (OD) values of triplicate datasets are shown. (B) HeLa cells were either left untreated or treated with 25 μM monensin for 30 min in the presence of transferrin (50 μg/ml) and the level of TfR at the cell surface was measured by flow cytometry (left-hand panel). Results are percentages of the mean fluorescence (fluoresc.) at zero time (means±S.E.M. for four experiments). In the right-hand panel, the basal decay of IFNAR2 from the cell surface was monitored in the presence (□) or absence (■) of monensin for the indicated times using flow cytometry. Results are percentages of the mean fluorescence (fluoresc.) at zero time (means±S.E.M. for three experiments). (C) IFNα2-induced IFNAR2 recycling. HeLa cells were treated with 500 pM IFNα2 (left-hand panels) or IFNβ (right-hand panels) in the presence (○) or absence (●) of monensin for the indicated times, and the surface levels of IFNAR1 and IFNAR2 were analysed by flow cytometry. Results are percentages of the mean fluorescence (fluoresc.) at zero time (means±S.E.M. for three experiments).
Similar articles
- Ligand-induced assembling of the type I interferon receptor on supported lipid bilayers.
Lamken P, Lata S, Gavutis M, Piehler J. Lamken P, et al. J Mol Biol. 2004 Jul 30;341(1):303-18. doi: 10.1016/j.jmb.2004.05.059. J Mol Biol. 2004. PMID: 15312780 - Mutational and structural analysis of the binding interface between type I interferons and their receptor Ifnar2.
Piehler J, Schreiber G. Piehler J, et al. J Mol Biol. 1999 Nov 19;294(1):223-37. doi: 10.1006/jmbi.1999.3230. J Mol Biol. 1999. PMID: 10556041 - Initial expression of interferon alpha receptor 2 (IFNAR2) on CD34-positive cells and its down-regulation correlate with clinical response to interferon therapy in chronic myelogenous leukemia.
Ito K, Tanaka H, Ito T, Sultana TA, Kyo T, Imanaka F, Ohmoto Y, Kimura A. Ito K, et al. Eur J Haematol. 2004 Sep;73(3):191-205. doi: 10.1111/j.1600-0609.2004.00275.x. Eur J Haematol. 2004. PMID: 15287917 - Systems biology of JAK/STAT signalling.
Pfeifer AC, Timmer J, Klingmüller U. Pfeifer AC, et al. Essays Biochem. 2008;45:109-20. doi: 10.1042/BSE0450109. Essays Biochem. 2008. PMID: 18793127 Review.
Cited by
- Hope and fear for interferon: the receptor-centric outlook on the future of interferon therapy.
Fuchs SY. Fuchs SY. J Interferon Cytokine Res. 2013 Apr;33(4):211-25. doi: 10.1089/jir.2012.0117. J Interferon Cytokine Res. 2013. PMID: 23570388 Free PMC article. Review. - The interferons and their receptors--distribution and regulation.
de Weerd NA, Nguyen T. de Weerd NA, et al. Immunol Cell Biol. 2012 May;90(5):483-91. doi: 10.1038/icb.2012.9. Epub 2012 Mar 13. Immunol Cell Biol. 2012. PMID: 22410872 Free PMC article. Review. - STAM and Hrs interact sequentially with IFN-α Receptor to control spatiotemporal JAK-STAT endosomal activation.
Zanin N, Viaris de Lesegno C, Podkalicka J, Meyer T, Gonzalez Troncoso P, Bun P, Danglot L, Chmiest D, Urbé S, Piehler J, Blouin CM, Lamaze C. Zanin N, et al. Nat Cell Biol. 2023 Mar;25(3):425-438. doi: 10.1038/s41556-022-01085-6. Epub 2023 Feb 16. Nat Cell Biol. 2023. PMID: 36797476 - MALAT1 is involved in type I IFNs-mediated systemic lupus erythematosus by up-regulating OAS2, OAS3, and OASL.
Gao F, Tan Y, Luo H. Gao F, et al. Braz J Med Biol Res. 2020 Apr 17;53(5):e9292. doi: 10.1590/1414-431X20209292. eCollection 2020. Braz J Med Biol Res. 2020. PMID: 32321151 Free PMC article. - CD80+ and CD86+ B cells as biomarkers and possible therapeutic targets in HTLV-1 associated myelopathy/tropical spastic paraparesis and multiple sclerosis.
Menezes SM, Decanine D, Brassat D, Khouri R, Schnitman SV, Kruschewsky R, López G, Alvarez C, Talledo M, Gotuzzo E, Vandamme AM, Galvão-Castro B, Liblau R, Weyenbergh JV. Menezes SM, et al. J Neuroinflammation. 2014 Jan 29;11:18. doi: 10.1186/1742-2094-11-18. J Neuroinflammation. 2014. PMID: 24472094 Free PMC article.
References
- Vilcek J. Fifty years of interferon research: aiming at a moving target. Immunity. 2006;25:343–348. - PubMed
- Pestka S., Krause C. D., Walter M. R. Interferons, interferon-like cytokines, and their receptors. Immunol. Rev. 2004;202:8–32. - PubMed
- Haan C., Kreis S., Margue C., Behrmann I. Jaks and cytokine receptors: an intimate relationship. Biochem. Pharmacol. 2006;72:1538–1546. - PubMed
- Rani M. R., Ransohoff R. M. Alternative and accessory pathways in the regulation of IFN-β-mediated gene expression. J. Interferon Cytokine Res. 2005;25:788–798. - PubMed


