Phenotypic and functional features of human Th17 cells - PubMed (original) (raw)
. 2007 Aug 6;204(8):1849-61.
doi: 10.1084/jem.20070663. Epub 2007 Jul 16.
Lorenzo Cosmi, Veronica Santarlasci, Laura Maggi, Francesco Liotta, Benedetta Mazzinghi, Eliana Parente, Lucia Filì, Simona Ferri, Francesca Frosali, Francesco Giudici, Paola Romagnani, Paola Parronchi, Francesco Tonelli, Enrico Maggi, Sergio Romagnani
Affiliations
- PMID: 17635957
- PMCID: PMC2118657
- DOI: 10.1084/jem.20070663
Phenotypic and functional features of human Th17 cells
Francesco Annunziato et al. J Exp Med. 2007.
Abstract
T helper (Th) 17 cells represent a novel subset of CD4+ T cells that are protective against extracellular microbes, but are responsible for autoimmune disorders in mice. However, their properties in humans are only partially known. We demonstrate the presence of Th17 cells, some of which produce both interleukin (IL)-17 and interferon (IFN)-gamma (Th17/Th1), in the gut of patients with Crohn's disease. Both Th17 and Th17/Th1 clones showed selective expression of IL-23R, CCR6, and the transcription factor ROR gamma t, and they exhibited similar functional features, such as the ability to help B cells, low cytotoxicity, and poor susceptibility to regulation by autologous regulatory T cells. Interestingly, these subsets also expressed the Th1-transcription factor T-bet, and stimulation of these cells in the presence of IL-12 down-regulated the expression of ROR gamma t and the production of IL-17, but induced IFN-gamma. These effects were partially inhibited in presence of IL-23. Similar receptor expression and functional capabilities were observed in freshly derived IL-17-producing peripheral blood and tonsillar CD4+ T cells. The demonstration of selective markers for human Th17 cells may help us to understand their pathogenic role. Moreover, the identification of a subset of cells sharing features of both Th1 and Th17, which can arise from the modulation of Th17 cells by IL-12, may raise new issues concerning developmental and/or functional relationships between Th17 and Th1.
Figures
Figure 1.
Ex vivo identification of human Th17 and Th17/Th1. (A) CD4+ T cells from PB of healthy subjects, healthy gut areas of subjects with colon carcinoma, and PB and disease-affected gut areas of subjects with CD were assessed by intracellular staining with flow cytometry for their ability to produce IFN-γ (black), IL-4 (gray), or IL-17 (white) after stimulation with PMA plus ionomycin. (B) Proportions of IL-17–producing cells able to also produce IFN-γ (black) or IL-4 (gray) among CD4+ T cells from PB or gut of subjects with CD. Columns in A and B represent mean values (± the SEM) obtained from 10 different subjects for each group. a versus c, P < 0.05; b versus c, P < 0.05; d versus e, P < 0.05. (C) Representative flow cytometric analyses in PB and gut of one subject with CD.
Figure 2.
Cytokine production by in vitro–expanded CD4+ T cells from PB and gut and by T cell clones from gut of subjects with CD. (A) CD4+ T cells from PB or disease-affected gut areas of 10 subjects with CD were stimulated for 7 d with anti-CD3 plus anti-CD28 mAb and IL-2, and their ability to produce IFN-γ (black), IL-4 (gray), or IL-17 (white) was assessed (see Fig. 1 legend). Columns represent the mean values (± the SEM). a versus b, P < 0.05. (B) Representative flow cytometric analyses on expanded PB or gut CD4+ T cells from the same CD subject. (C) A total number of 217 T cell clones (circles) were obtained from CD4+ T cells of disease-affected gut areas of two subjects with CD and assessed by flow cytometry for intracellular synthesis of IFN-γ, IL-4, and IL-17 after stimulation with PMA plus ionomycin. Production of cytokines by each clone was arbitrarily considered as noteworthy when the proportion of producing T cell blasts was >20%. (D) Representative flow cytometric analyses of cytokine production for each type of clone.
Figure 3.
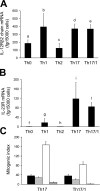
IL-23R and -12Rβ2 expression by Th17 and Th17/Th1 clones and their role in cell proliferation. IL-12Rβ2 (A) and -23R (B) mRNA levels were measured in Th0, Th1, Th2, Th17, and Th17/Th1 clones. Columns represent mean values (± the SEM) obtained in 10 clones from each type, except Th2, where they represent 7 clones. (A) d versus a, P < 0.05; d versus b, P = ns; d versus c, P < 0.05; d versus e, P = ns; e versus a, P < 0.05; e versus b, P = ns; e versus c, P < 0.05. (B) i versus f, P < 0.01; i versus g, P < 0.05; i versus h, P < 0.05; i versus l, P = ns; l versus f, P < 0.001; l versus g, P < 0.05; l versus h, P < 0.05. (C) Proliferative response of Th17 and Th17/Th1 clones after stimulation for 4 d with anti-CD3 plus anti-CD28 Ab without or with the addition of IL-2 (black), IL-12 (gray), IL-15 (white), or IL-23 (striped). Columns represent mean values (± the SEM) of mitogenic indexes (ratio between cpm obtained in the presence of anti-CD3/28 Ab with the indicated cytokine and cpm obtained with anti-CD3/CD28 Ab alone), obtained by testing seven clones from each type.
Figure 4.
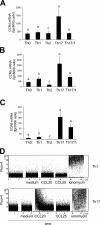
Selective expression of functionally active CCR6 by Th17 and Th17/Th1 clones. CCR4 (A), CCR5 (B), and CCR6 (C) mRNA levels in Th0, Th1, Th2, Th17, and Th17/Th1 clones. Columns represent mean values (± the SEM) obtained in 10 clones from each type, except Th2, where they represent 7 clones. (A) d versus a, P < 0.005; d versus b, P < 0.05; d versus c, P < 0.05; d versus e, P < 0.005; e versus a, P = ns; e versus b, P = ns; e versus c, P = ns. (B) d versus a, P < 0.001; d versus b, P < 0.05; d versus c, P < 0.05; d versus e, P < 0.01; e versus a, P < 0.05; e versus b, P = ns; e versus c, P = ns. (C) d versus a, P < 0.0001; d versus b, P < 0.001; d versus c, P < 0.001; d versus e, P = ns; e versus a, P < 0.05; e versus b, P < 0.05; e versus c, P < 0.05. (D) Cells from one Th17 and one Th1 clone were incubated with Fluo-4 and stimulated with medium alone, the CCR6 ligand, CCL20, the CCR9 ligand, CCL25, or ionomycin. Similar results were obtained with other two Th17 and three Th17/Th1 clones.
Figure 5.
B cell helper ability and cytotoxic potential by Th17 and Th17/Th1 clones. (A) Measurement by ELISA of IgM, IgG, IgA, and IgE levels in supernatants of B cells cocultured for 7 d with autologous anti-CD3 Ab-stimulated Th1, Th2, Th17, or Th17/Th1 clones. Columns represent mean values (± the SEM) of five different clones from each group. b versus a, P < 0.05; c versus a, P < 0.05; b versus c, P = ns. (B) Granzyme A expression by different types of clones, as assessed by flow cytometry. Columns represent mean values (± the SEM) obtained with seven different clones of each type. c versus a, P < 0.005; c versus b, P = ns; c versus d, P < 0.05; d versus a, P < 0.01; d versus b, P = ns. (C) Cytotoxic activity by different types of clones, as assessed by detection of AnnexinV binding on target cells P815 with flow cytometry. Columns represent mean values (± the SEM) obtained with six different clones from each group. c versus a, P < 0.01; c versus b, P = ns; c versus d, P < 0.05; d versus a, P < 0.05; d versus b, P = ns.
Figure 6.
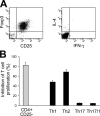
Low susceptibility of Th17 and Th17/Th1 clones to the suppressive activity of an autologous T reg cell clone. (A) Foxp3 and CD25 expression by the T reg cell clone (left) and its inability to produce IL-4 and IFN-γ in response to PMA plus ionomycin (right), as detected by flow cytometry. (B) Suppression by the T reg cell clone of the proliferative response of autologous CD4+CD25− T cells stimulated with allogeneic irradiated PBMC, as well as of an autologous Th1 or Th2, but not Th17 or Th17/Th1, clone. Columns represent mean values (± the SEM) of percentage of inhibition of the proliferative response in triplicate determinations.
Figure 7.
Expression of T-bet and RORγt by Th17 and Th17/Th1 clones. RORγt (A), T-bet (B), and GATA-3 (C) mRNA levels were measured in Th0, Th1, Th2, Th17, and Th17/Th1 clones. Columns represent mean values (± the SEM) in 10 clones from each type, except Th2, where they represent 7 clones. (A) d versus a, P < 0.0001; d versus b, P < 0.005; d versus c, P < 0.05; d versus e, P = ns; e versus a, P < 0.001; e versus b, P < 0.01; e versus c, P < 0.05. (B) d versus a, P = ns; d versus b, P = ns; d versus c, P < 0.05; d versus e, P = ns; e versus a, P = ns; e versus b, P = ns; e versus c, P = ns; b versus c, P < 0.05. (C) d versus a, P = ns; d versus b, P = ns; d versus c, P < 0.05; e versus a, P < 0.001; e versus b, P = ns; e versus c, P < 0.001; b versus c, P < 0.001. RORγt (D) and T-bet (E) protein expression, as assessed by confocal microscopy. Data from one Th17 and one Th1 clone are reported. Similar pictures were obtained in other two Th17 and two Th1 clones. Bars, 10 μm. TO-PRO-3 (red) was used to counterstain the nuclei.
Figure 8.
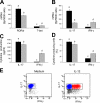
Effects of IL-12 on RORγt and T-bet expression and on IFN-γ and IL-17 production by Th17 clones. (A) Decreased RORγt and increased T-bet mRNA expression in five Th17 clones after stimulation for 7 d with anti-CD3 plus anti-CD28 Ab and IL-2, in the absence (black) or presence (gray) of IL-12. a versus b, P < 0.05; c versus d, P < 0.05. (B) Decreased IL-17 and increased IFN-γ mRNA levels in Th17 clones cultured under the conditions described in A. Columns represent mean values (± the SEM). a versus b, P < 0.01; c versus d, P < 0.01. (C) Reduced levels of IL-17 and increased levels of IFN-γ in supernatants of Th17 clones, as measured by ELISA. a versus b, P < 0.05; c versus d, P < 0.001. (D) Decreased proportions of IL-17–producing and increased proportions of IFN-γ–producing cells in response to PMA plus ionomycin by Th17 clones. a versus b, P < 0.05; c versus d, P < 0.05. (E) Flow cytometric analysis of IL-17 and IFN-γ production by one representative Th17 clone.
Figure 9.
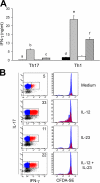
IL-23 partially inhibits the increase of IFN-γ production and the proliferation induced by IL-12 on Th17 clones. (A) Detection of IFN-γ into cell-free supernatants of Th17 and Th1 clones cultured for 7 d with anti-CD3/CD28 and IL-2 (black), plus IL-12 (gray), -23 (white), or -12 plus -23 (striped). Columns represent mean values (± the SEM) obtained in three different Th17 and in three different Th1 clones. a versus b, P < 0.05; b versus c, P < 0.05; d versus e, P < 0.05; e versus f, P < 0.05. (B) Flow cytometric analysis of IL-17 and IFN-γ production by one representative Th17 clone, and of its proliferation, as assessed by CFDA-SE content. Similar results were obtained in other two Th17 clones.
Figure 10.
Th17 clones derived from normal gut, as well as freshly derived IL-17–producing CD4+ T cells, exhibit similar features to gut CD-derived Th17 clones. (A) CCR6, IL-23R, and RORγt mRNA expression by Th1, Th17, and Th17/Th1 clones derived from normal gut of subjects who underwent colectomy because of colon carcinoma. Columns represent mean values (± the SEM) obtained from five clones of each type. (B) Detection of IL-17 and IFN-γ production by CCR6-depleted and CCR6-enriched CD4+ T cell populations from PB or tonsil (top). Measurement of IL-23R and RORγt mRNA levels in CCR6-depleted (black columns) and CCR6-enriched (red columns) CD4+ T cells from PB (left) or tonsils (right). Columns represent mean values ± the SEM were obtained in three different donors of PB or tonsil.
Similar articles
- Properties and origin of human Th17 cells.
Romagnani S, Maggi E, Liotta F, Cosmi L, Annunziato F. Romagnani S, et al. Mol Immunol. 2009 Nov;47(1):3-7. doi: 10.1016/j.molimm.2008.12.019. Epub 2009 Feb 3. Mol Immunol. 2009. PMID: 19193443 Review. - Fetal BM-derived mesenchymal stem cells promote the expansion of human Th17 cells, but inhibit the production of Th1 cells.
Guo Z, Zheng C, Chen Z, Gu D, Du W, Ge J, Han Z, Yang R. Guo Z, et al. Eur J Immunol. 2009 Oct;39(10):2840-9. doi: 10.1002/eji.200839070. Eur J Immunol. 2009. PMID: 19637224 - IL-12 inhibits the TGF-β-dependent T cell developmental programs and skews the TGF-β-induced differentiation into a Th1-like direction.
Prochazkova J, Pokorna K, Holan V. Prochazkova J, et al. Immunobiology. 2012 Jan;217(1):74-82. doi: 10.1016/j.imbio.2011.07.032. Epub 2011 Aug 5. Immunobiology. 2012. PMID: 21903294 - IFN-beta inhibits human Th17 cell differentiation.
Ramgolam VS, Sha Y, Jin J, Zhang X, Markovic-Plese S. Ramgolam VS, et al. J Immunol. 2009 Oct 15;183(8):5418-27. doi: 10.4049/jimmunol.0803227. Epub 2009 Sep 25. J Immunol. 2009. PMID: 19783688 - Targeting the development and effector functions of TH17 cells.
Ghilardi N, Ouyang W. Ghilardi N, et al. Semin Immunol. 2007 Dec;19(6):383-93. doi: 10.1016/j.smim.2007.10.016. Epub 2008 Jan 14. Semin Immunol. 2007. PMID: 18083530 Review.
Cited by
- Differential effects of HIV transmission from monocyte-derived dendritic cells vs. monocytes to IL-17+CD4+ T cells.
Mitsuki YY, Tuen M, Hioe CE. Mitsuki YY, et al. J Leukoc Biol. 2017 Jan;101(1):339-350. doi: 10.1189/jlb.4A0516-216R. Epub 2016 Aug 16. J Leukoc Biol. 2017. PMID: 27531931 Free PMC article. - Cytokine-induced cytokine production by conventional and innate lymphoid cells.
Guo L, Junttila IS, Paul WE. Guo L, et al. Trends Immunol. 2012 Dec;33(12):598-606. doi: 10.1016/j.it.2012.07.006. Epub 2012 Sep 5. Trends Immunol. 2012. PMID: 22959641 Free PMC article. Review. - T Helper Cell Activation and Expansion Is Sensitive to Glutaminase Inhibition under Both Hypoxic and Normoxic Conditions.
Sener Z, Cederkvist FH, Volchenkov R, Holen HL, Skålhegg BS. Sener Z, et al. PLoS One. 2016 Jul 28;11(7):e0160291. doi: 10.1371/journal.pone.0160291. eCollection 2016. PLoS One. 2016. PMID: 27467144 Free PMC article. - Paucity of IL-21-producing CD4(+) T cells is associated with Th17 cell depletion in SIV infection of rhesus macaques.
Micci L, Cervasi B, Ende ZS, Iriele RI, Reyes-Aviles E, Vinton C, Else J, Silvestri G, Ansari AA, Villinger F, Pahwa S, Estes JD, Brenchley JM, Paiardini M. Micci L, et al. Blood. 2012 Nov 8;120(19):3925-35. doi: 10.1182/blood-2012-04-420240. Epub 2012 Sep 18. Blood. 2012. PMID: 22990011 Free PMC article. - Loss of mucosal CD103+ DCs and IL-17+ and IL-22+ lymphocytes is associated with mucosal damage in SIV infection.
Klatt NR, Estes JD, Sun X, Ortiz AM, Barber JS, Harris LD, Cervasi B, Yokomizo LK, Pan L, Vinton CL, Tabb B, Canary LA, Dang Q, Hirsch VM, Alter G, Belkaid Y, Lifson JD, Silvestri G, Milner JD, Paiardini M, Haddad EK, Brenchley JM. Klatt NR, et al. Mucosal Immunol. 2012 Nov;5(6):646-57. doi: 10.1038/mi.2012.38. Epub 2012 May 30. Mucosal Immunol. 2012. PMID: 22643849 Free PMC article.
References
- Mosmann, T.R., H. Cherwinski, M.W. Bond, M.A. Giedlin, and R.L. Coffman. 1986. Two types of murine helper T cell clone. I. Definition according to profiles of lymphokine activities and secreted proteins. J. Immunol. 136:2348–2357. - PubMed
- Del Prete, G.F., M. De Carli, C. Mastromauro, R. Biagiotti, D. Macchia, P. Falagiani, M. Ricci, and S. Romagnani. 1991. Purified protein derivative of Mycobacterium tuberculosis and excretorysecretory antigen(s) of Toxocara canis expand in vitro human T cells with stable and opposite (type 1 T helper or type 2 T helper) profile of cytokine production. J. Clin. Invest. 88:346–350. - PMC - PubMed
- Abbas, A.K., K.M. Murphy, and A. Sher. 1996. Functional diversity of helper T lymphocytes. Nature. 383:787–793. - PubMed
- Romagnani, S. 1997. The Th1/Th2 paradigm. Immunol. Today. 18:263–266. - PubMed
- Mosmann, T.R., and S. Sad. 1996. The expanding universe of T-cell subsets: Th1, Th2 and more. Immunol. Today. 17:138–146. - PubMed
Publication types
MeSH terms
Substances
LinkOut - more resources
Full Text Sources
Other Literature Sources
Molecular Biology Databases
Research Materials


