AKAP79/150 anchoring of calcineurin controls neuronal L-type Ca2+ channel activity and nuclear signaling - PubMed (original) (raw)
Comparative Study
AKAP79/150 anchoring of calcineurin controls neuronal L-type Ca2+ channel activity and nuclear signaling
Seth F Oliveria et al. Neuron. 2007.
Abstract
Neuronal L-type calcium channels contribute to dendritic excitability and activity-dependent changes in gene expression that influence synaptic strength. Phosphorylation-mediated enhancement of L-type channels containing the CaV1.2 pore-forming subunit is promoted by A-kinase anchoring proteins (AKAPs) that target cAMP-dependent protein kinase (PKA) to the channel. Although PKA increases L-type channel activity in dendrites and dendritic spines, the mechanism of enhancement in neurons remains poorly understood. Here, we show that CaV1.2 interacts directly with AKAP79/150, which binds both PKA and the Ca2+/calmodulin-activated phosphatase calcineurin (CaN). Cotargeting of PKA and CaN by AKAP79/150 confers bidirectional regulation of L-type current amplitude in transfected HEK293 cells and hippocampal neurons. However, anchored CaN dominantly suppresses PKA enhancement of the channel. Additionally, activation of the transcription factor NFATc4 via local Ca2+ influx through L-type channels requires AKAP79/150, suggesting that this signaling complex promotes neuronal L channel signaling to the nucleus through NFATc4.
Figures
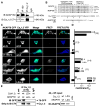
Figure 1. CaV1.2 and AKAP79/150 interact directly
(A) Lysates from primary cultured hippocampal neurons (12–17 DIV) were immunoprecipitated (IP) and then immunoblotted (IB) with anti-AKAP150 or anti-CaV1.2 C-terminal (CT4) antibodies (n = 3). Extract lane exposure times were 5 min, all other exposure times were 1 min. Control lane (IgG, right), IP with non-specific rabbit IgG. (B) Top, Alignment of human AKAP79, rat AKAP150, and orthologs from other species showing conservation of heptad-spaced hydrophobic residues between the end of the PKA-RII anchoring region and the C-terminus. Bottom, LZ motif alanine substitution mutants (LZm) introduced into AKAP79 and CaV1.2. (C) Micrographs of transfected HEK293 cells showing subcellular localization of AKAP79-CFP (donor), CaV1.2-YFP (acceptor), CFP-YFP colocalization (Merge), and corrected, sensitized CFP-YFP FRET (FRETc; monochrome), and FRETC gated to donor intensity (FRETC(CFP); pseudocolor). N and C indicate fluorophore fusion to the N- or C-terminus. (D) Effective FRET efficiency (E_eff) calculated from both 3-filter set measurements (3F) and YFP-acceptor photobleach (PB) measurements from the same cells (n values indicated in parentheses; * P = 0.025, # P = 0.018, *** P = 2.46 × 10⁻⁶, ### P = 4.20 × 10⁻⁷, relative to the upper row of data). (E) Left,_ LZ mutations disrupt coIP of CaV1.2 and AKAP79 in HEK 293 cells. Lysates from cells transfected with either wt or LZm forms of CaV1.2 and AKAP79-CFP were IP’d with the anti-CaV1.2 CT4 antibody and then probed by western blotting with an anti-GFP antibody that recognizes CFP-fused AKAP79. The same blot was stripped of anti-GFP and re-probed with the anti-CaV1.2 CT4 antibody. Extract lane was loaded with 50 μg total protein, CaV1.2 band is visible on the strip and re-probe blot at longer exposure times as in A. Right, Western blot of 40 μl IP input lysates. Untransfected control lysate marked as untx.
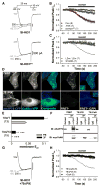
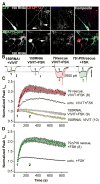
Figure 2. Down-regulation of CaV1.2 currents in HEK293 cells following disruption of PKA anchoring
(A) Representative CaV1.2 current records demonstrating the effect of St-Ht31 (top) or its inactive analog, St-Ht31pro (bottom), applied from 0 s onward to forskolin (FSK)-stimulated cells co-transfected with AKAP79-YFP and CaV1.2 channel subunits. (B) Average time course of St-Ht31 effect on peak current amplitude. All experiments were performed in the presence of FSK except where otherwise indicated. Black bar indicates duration of St-Ht31 application. (Con), Current down-regulation in response to St-Ht31 in cells transfected with wild type CaV1.2 and AKAP79.
 (-FSK), Effect of St-Ht31 in the absence of FSK.
  , (St-Ht31pro) Response to application of a proline-substituted form of St-Ht31. (C) St-Ht31 application to cells coexpressing either LZm forms CaV1.2 and AKAP79 (LZm/LZm,
  ), or the CaV1.2 phosphorylation site mutant S1928A and wild-type AKAP79 (S1928A,
  ). (D) Representative micrographs of COS7 cells demonstrating subcellular localization and 3-filter sensitized FRETC (presented as in Figure 1C) between CFP-labeled AKAP79 (79WT, top) or AKAP79 lacking the core PXIXIT-like motif of the CaN binding site (79ΔPIX, bottom) and CaN A-YFP. (E) Effective membrane FRET efficiencies (E_eff) for AKAP79WT-CFP or AKAP79ΔPIX-CFP and CaN A-YFP as measured by acceptor photobleaching (PB) and 3-filter (3F) methods (n values indicated in parentheses; *** P = 1.38 × 10⁻⁶ and ### P = 2.16 × 10⁻⁷). (F) Top,_ immunoprecipitations (IP) of myc-tagged CaNA (α-myc) from lysates of HEK293 cells transfected with myc-CaNA and either 79WT, 79ΔPIX or AKAP79ΔCaN, probed with anti-AKAP79. Bottom, the same blot was stripped of anti-AKAP79 and re-probed with anti-myc (n = 3 for both panels). (G) Representative current records from HEK293 cells expressing 79ΔPIX-YFP and wild type CaV1.2 exposed to St-Ht31 beginning at 0 s. (H) Average peak current time course following St-Ht31 application to cells expressing wild type CaV1.2 and 79ΔCaN-YFP(
 ) or 79ΔPIX-YFP (
 ), or wild type CaV1.2 and AKAP79-YFP in the presence of the CaN inhibitor cyclosporin A (CsA, ◆). In C and H, small dots reproduce the time course of St-Ht31 action in the control condition shown in B as
  .
.
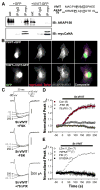
Figure 3. VIVIT disrupts AKAP79/150 anchoring of CaN and increases CaV1.2 current amplitude
(A) Immunoprecipitations (IP) of myc-tagged CaNA (myc) from lysates of HEK293 cells transfected with myc-CaNA, AKAP150 and either GFP or VIVIT-GFP, probed with anti-AKAP150. (B) Micrographs of COS7 cells demonstrating subcellular localization of transfected AKAP79 (indirectly immunolabeled with Alexa Fluor 647) and myc-tagged CaN (indirectly immunolabeled with Texas Red) in cells expressing either GFP or VIVIT-GFP. Right, sequence of the entire VIVIT peptide and residues 333-348 of AKAP79. (C) Representative currents showing the effect St-VIVIT applied beginning at 0 s on cells co-transfected with AKAP79-YFP and CaV1.2 channel subunits in the presence (top) or absence (middle) of FSK, or in FSK-stimulated cells expressing AKAP79ΔPIX (bottom). (D) Average time course of St-VIVIT effect on peak current amplitude. Currents were recorded in FSK except where otherwise indicated. Black bar indicates the duration of St-VIVIT application.  (Con), Current up-regulation in response to St-VIVIT in cells transfected with wild type CaV1.2 and AKAP79.
  (-FSK), Effect of St-VIVIT in the absence of FSK.
  (79ΔPIX) Effect of St-VIVIT in cells expressing 79ΔPIX-YFP. (E) St-VIVIT application to cells expressing LZm forms of both CaV1.2 and AKAP79 (LZm/LZm, ◇), wild type CaV1.2 and a PKA binding-deficient AKAP79 containing A396P and I404P mutations (79pro2,
  ), the CaV1.2 phosphorylation site mutant S1928A and wild type AKAP79 (S1928A,
  ), or to cells expressing wild type CaV1.2 and AKAP79 preincubated with the PKA inhibitor PKI (PKI,
  ). Small dots reproduce the control condition shown in D as
  .
.
Figure 4. Reversal by CaN of FSK enhancement of CaV1.2 current
(A) Superimposed, selected currents elicited by a 1 Hz train of 20 ms step depolarizations (left), and current record after recovery of enhancement during a train of 20 ms depolarizations at 1/min (right). Currents recorded from HEK293 cells expressing CaV1.2-based channels and AKAP79-YFP, and bathed in FSK. (B) Peak inward Ca2+ current amplitude in response to changes in step depolarization frequency. Pipet solution contained 10 mM EGTA, CaN autoinhibitory peptide + 10 mM EGTA, or 10 mM BAPTA. For the 10 mM EGTA data, recovery of current amplitude during 1/min depolarization was fit with a single exponential function (solid black curve). Time courses corrected for the rate of channel rundown at 0.2 Hz prior to 1 Hz stimulation. Error bars for all data points are plotted in gray.
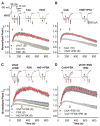
Figure 5. Anchored PKA and CaN have opposing effects on L-type Ca2+ current in cultured hippocampal pyramidal neurons
Peptides and other drugs were applied intracellularly via the patch pipet. Representative current recordings are shown for each time course as indicated; black records and colored records show currents 60 s (time point 1) and 250 s (time point 2) after establishing the whole cell recording configuration, respectively. All scale bars indicate 600 pA. (A) Average peak current time course during dialysis of intracellular recording solution alone (Con,  ) or in the presence of either VIVIT (
 ) or Ht31 (
 ). (B) The effect of CsA dialysis (
 ) and co-application of VIVIT and PKI (
 ). (C and D) as in A and B, but with FSK added to the intracellular recording solution.
Figure 6. The effect of VIVIT on neuronal L-type Ca2+ channels is specific to AKAP79/150
(A) Top, micrographs of primary cultured hippocampal neurons transfected with the pSilencerAKAP150-short hairpin RNAi construct (150 RNAi) and GFP, demonstrating suppression (marked with GFP and arrows) of endogenous AKAP150 (red, indirectly immunolabeled with Texas Red). Bottom, simultaneous RNAi suppression of AKAP150 expression and rescue with AKAP79-GFP in hippocampal neurons. Normal levels of AKAP150 staining are seen in adjacent untransfected neurons. PSD-95 staining (blue, indirectly immunolabeled with Alexa Fluor 647) is a postsynaptic marker of excitatory synapses. (B) Representative current recordings 60 s (time point 1, black traces) and 250 s (time point 2, colored traces) after establishing the whole cell recording configuration for 150RNAi + VIVIT, 150RNAi + VIVIT + FSK, 79rescue + VIVIT + FSK and 79ΔPIX + FSK conditions. All scale bars indicate 600 pA. (C) Average peak current timecourse for cells expressing 150RNAi and GFP during VIVIT dialysis (150RNAi, VIVIT,  ) or co-application of VIVIT and FSK (150RNAi, VIVIT + FSK,
  ), and for cells rescued from AKAP150 knockdown by AKAP79-GFP co-transfection (79 rescue, VIVIT + FSK,
  ). Small dots reproduce the effect of VIVIT + FSK observed in untransfected neurons (
 from Fig. 4C). (D) The effect of FSK alone on neurons after AKAP150 knockdown and replacement with AKAP79ΔPIX-YFP (79ΔPIX rescue, +FSK,
  ). Small dots reproduce the effect of FSK in untransfected neurons (
 from Figure 4C).
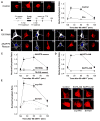
Figure 7. AKAP79/150 couples L-type Ca2+ channel activity to NFATc4 activation via targeting of CaN
Following a 3 h preincubation in tetrodotoxin (TTX), primary cultured hippocampal neurons were stimulated by 3 min exposure to high (90 mM) K+ Tyrode’s solution and then fixed at the indicated time points (stimulation protocol schematized in the lower left of A). n = 20–30 cells for each point in averaged time courses. (A) Left, deconvolved projection images collected at each time point (NS, not stimulated). NFATc4 distribution was determined by indirect immunofluorescence (Texas Red) and nuclei were stained with DAPI (images not shown). Right, average time course of NFATc4 nuclear translocation following application of high K+ solution for untreated cells (Con) and cells treated with the L channel antagonist nimodipine (Nim). (B) Images of immunolabeled NFATc4 for cells transfected with 150 RNAi and GFP (150 RNAi) or with 150 RNAi and AKAP79-GFP (AKAP79 rescue). GFP (or AKAP79-GFP) expression (white) was used as a marker for cells transfected with the AKAP150 RNAi construct. Nuclei were stained with DAPI (blue). (C) Time course of NFATc4 translocation for the 150 RNAi, AKAP79 rescue and 79ΔPIX rescue (150 RNAi and 79ΔPIX-YFP) conditions. (D) Time course of NFATc4 translocation for cells loaded with either EGTA-AM or BAPTA-AM. Representative images shown below the time course plots. (E) Time course of NFATc4 translocation for cells preincubated with myristoylated PKI (myr-PKI) or St-Ht31. Dashed line reproduces the time course for the control condition shown in A. Representative images shown to the right of the time course plots.
Figure 8. AKAP79/150 confers two distinct properties upon neuronal L-type Ca2+ channels
(A) AKAP79/150-anchored CaN (red) strongly opposes L channel phosphorylation by PKA (green). Calmodulin (CaM, blue) binds directly to the proximal C-terminus of CaV1.2, where it mediates Ca2+-dependent inactivation of the channel (Cens et al., 1999; Erickson et al., 2003; Tillotson, 1979; Zuhlke et al., 1999). It is not known whether this CaM molecule, another CaM molecule associated with the channel or free CaM activates CaN in response to Ca2+ influx. (B) AKAP79/150 targeting of CaN to L channels is necessary for NFATc4 activation. The known roles of CaM and PKA in nuclear signaling are also illustrated. CaM binding to the CaV1.2 C-terminus is critical for L channel-dependent activation of CREB (Dolmetsch et al., 2001), but the role of AKAP79/150 anchoring in PKA-dependent activation of CREB or CaN-dependent opposition to CREB phosphorylation has not been studied. Hash marks represent multiple steps and/or long distances involved in signaling pathways that affect transcription factor activation.
Similar articles
- AKAP79/150 recruits the transcription factor NFAT to regulate signaling to the nucleus by neuronal L-type Ca2+ channels.
Murphy JG, Crosby KC, Dittmer PJ, Sather WA, Dell'Acqua ML. Murphy JG, et al. Mol Biol Cell. 2019 Jul 1;30(14):1743-1756. doi: 10.1091/mbc.E19-01-0060. Epub 2019 May 15. Mol Biol Cell. 2019. PMID: 31091162 Free PMC article. - AKAP-anchored PKA maintains neuronal L-type calcium channel activity and NFAT transcriptional signaling.
Murphy JG, Sanderson JL, Gorski JA, Scott JD, Catterall WA, Sather WA, Dell'Acqua ML. Murphy JG, et al. Cell Rep. 2014 Jun 12;7(5):1577-1588. doi: 10.1016/j.celrep.2014.04.027. Epub 2014 May 15. Cell Rep. 2014. PMID: 24835999 Free PMC article. - Regulation of A-kinase anchoring protein 79/150-cAMP-dependent protein kinase postsynaptic targeting by NMDA receptor activation of calcineurin and remodeling of dendritic actin.
Gomez LL, Alam S, Smith KE, Horne E, Dell'Acqua ML. Gomez LL, et al. J Neurosci. 2002 Aug 15;22(16):7027-44. doi: 10.1523/JNEUROSCI.22-16-07027.2002. J Neurosci. 2002. PMID: 12177200 Free PMC article. - Regulation of neuronal PKA signaling through AKAP targeting dynamics.
Dell'Acqua ML, Smith KE, Gorski JA, Horne EA, Gibson ES, Gomez LL. Dell'Acqua ML, et al. Eur J Cell Biol. 2006 Jul;85(7):627-33. doi: 10.1016/j.ejcb.2006.01.010. Epub 2006 Feb 28. Eur J Cell Biol. 2006. PMID: 16504338 Review. - A macromolecular trafficking complex composed of β₂-adrenergic receptors, A-Kinase Anchoring Proteins and L-type calcium channels.
Flynn R, Altier C. Flynn R, et al. J Recept Signal Transduct Res. 2013 Jun;33(3):172-6. doi: 10.3109/10799893.2013.782219. Epub 2013 Apr 4. J Recept Signal Transduct Res. 2013. PMID: 23557075 Review.
Cited by
- Selective down-regulation of KV2.1 function contributes to enhanced arterial tone during diabetes.
Nieves-Cintrón M, Nystoriak MA, Prada MP, Johnson K, Fayer W, Dell'Acqua ML, Scott JD, Navedo MF. Nieves-Cintrón M, et al. J Biol Chem. 2015 Mar 20;290(12):7918-29. doi: 10.1074/jbc.M114.622811. Epub 2015 Feb 10. J Biol Chem. 2015. PMID: 25670860 Free PMC article. - Phosphorylation, compartmentalization, and cardiac function.
Collins KB, Scott JD. Collins KB, et al. IUBMB Life. 2023 Apr;75(4):353-369. doi: 10.1002/iub.2677. Epub 2022 Oct 8. IUBMB Life. 2023. PMID: 36177749 Free PMC article. - Activation of NMDA receptors leads to phosphorylation of TRPV1 S800 by protein kinase C and A-Kinase anchoring protein 150 in rat trigeminal ganglia.
Lee J, Chung MK, Ro JY. Lee J, et al. Biochem Biophys Res Commun. 2012 Jul 27;424(2):358-63. doi: 10.1016/j.bbrc.2012.07.008. Epub 2012 Jul 10. Biochem Biophys Res Commun. 2012. PMID: 22789851 Free PMC article. - AKAP79 modulation of L-type channels involves disruption of intramolecular interactions in the CaV1.2 subunit.
Altier C, Dubel SJ, Barrere C, Jarvis SE, Stotz SC, Scott JD, Nargeot J, Zamponi GW, Bourinet E. Altier C, et al. Channels (Austin). 2012 May-Jun;6(3):157-65. doi: 10.4161/chan.20865. Epub 2012 May 1. Channels (Austin). 2012. PMID: 22677788 Free PMC article. - Mechanisms of specificity in neuronal activity-regulated gene transcription.
Lyons MR, West AE. Lyons MR, et al. Prog Neurobiol. 2011 Aug;94(3):259-95. doi: 10.1016/j.pneurobio.2011.05.003. Epub 2011 May 18. Prog Neurobiol. 2011. PMID: 21620929 Free PMC article. Review.
References
- Aramburu J, Yaffe MB, Lopez-Rodriguez C, Cantley LC, Hogan G, Rao A. Affinity-driven peptide selection of an NFAT inhibitor more selective than cyclosporin A. Science. 1999;285:2129–2133. - PubMed
- Artalejo CR, Elhamdani A, Palfrey HC. Calmodulin is the divalent cation receptor for rapid endocytosis, but not exocytosis, in adrenal chromaffin cells. Neuron. 1996;16:195–205. - PubMed
- Bading H, Ginty DD, Greenberg ME. Regulation of gene expression in hippocampal neurons by distinct calcium signaling pathways. Science. 1993;260:181–186. - PubMed
- Bauman AL, Goehring AS, Scott JD. Orchestration of synaptic plasticity through AKAP signaling complexes. Neuropharmacology. 2004;46:299–310. - PubMed
- Bean BP, Nowycky MC, Tsien RW. β-adrenergic modulation of calcium channels in frog ventricular heart cells. Nature. 1984;307:371–375. - PubMed
Publication types
MeSH terms
Substances
Grants and funding
- R01 NS035245/NS/NINDS NIH HHS/United States
- NS35245/NS/NINDS NIH HHS/United States
- R01 NS035245-08/NS/NINDS NIH HHS/United States
- R56 NS040701/NS/NINDS NIH HHS/United States
- NS051963/NS/NINDS NIH HHS/United States
- R01 MH080291/MH/NIMH NIH HHS/United States
- NS40701/NS/NINDS NIH HHS/United States
- F30 NS051963/NS/NINDS NIH HHS/United States
- R01 NS040701/NS/NINDS NIH HHS/United States
- R01 HL088548/HL/NHLBI NIH HHS/United States
- R01 HL088548-01/HL/NHLBI NIH HHS/United States
LinkOut - more resources
Full Text Sources
Other Literature Sources
Molecular Biology Databases
Miscellaneous
