PDZ domain binding selectivity is optimized across the mouse proteome - PubMed (original) (raw)
PDZ domain binding selectivity is optimized across the mouse proteome
Michael A Stiffler et al. Science. 2007.
Erratum in
- Science. 2007 Oct 19;318(5849):393
Abstract
PDZ domains have long been thought to cluster into discrete functional classes defined by their peptide-binding preferences. We used protein microarrays and quantitative fluorescence polarization to characterize the binding selectivity of 157 mouse PDZ domains with respect to 217 genome-encoded peptides. We then trained a multidomain selectivity model to predict PDZ domain-peptide interactions across the mouse proteome with an accuracy that exceeds many large-scale, experimental investigations of protein-protein interactions. Contrary to the current paradigm, PDZ domains do not fall into discrete classes; instead, they are evenly distributed throughout selectivity space, which suggests that they have been optimized across the proteome to minimize cross-reactivity. We predict that focusing on families of interaction domains, which facilitates the integration of experimentation and modeling, will play an increasingly important role in future investigations of protein function.
Figures
Fig. 1
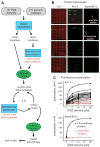
(A) Strategy for constructing a multidomain selectivity model for mouse PDZ domains. Protein microarrays were used to test all possible interactions between 157 mouse PDZ domains and 217 genome-encoded peptides. Array positives were retested and quantified by FP, thereby correcting array false positives. The resulting data were used to train a predictive model of PDZ domain selectivity. The model highlighted putative array false negatives, which were tested by FP, and the corrected data were used to retrain the model. After three cycles of prediction, testing, and retraining, the refined model was used to predict PDZ domain–protein interactions across the mouse proteome. (B) Representative images of protein microarrays, probed with fluorescently labeled peptides. PDZ domains were spotted in quadruplicate in individual wells of 96-well microtiter plates. (Four wells were required to accommodate all of the domains.) The red images (Cy5) show the location of the PDZ domain spots. The green images show arrays probed with a promiscuous peptide derived from Kv1.4 (left) and a selective peptide derived from ephrin B1/2 (right). (C) FP titration curves obtained for the array positives identified in (B).
Fig. 2
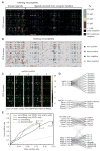
(A) Graphical view of the training-set data. K_d’s of FP-confirmed positives are represented by colors, ranging from high affinity (red) to low affinity (light blue). Array negatives are shown in black, and FP-confirmed negatives are shown in dark blue. Numerical values are provided in table S3. (B) Performance of the MDSM on the training set, with m set to 5. True positives are shown in red, false positives in green, true negatives in blue, and false negatives in yellow. (C) Graphical representation of the MDSM parameters, θ_i,p,q. Positive contributions to discriminative binding are graded from black to yellow, and negative contributions are graded from black to light blue. Numerical values are provided in table S4. Single-letter abbreviations for the amino acid residues are as follows: A, Ala; C, Cys; D, Asp; E, Glu; F, Phe; G, Gly; H, His; I, Ile; K, Lys; L, Leu; M, Met; N, Asn; P, Pro; Q, Gln; R, Arg; S, Ser; T, Thr; V, Val; W, Trp; and Y, Tyr. (D) Tight clusters embedded in the bipartite interaction network between the 74 PDZ domains and the 217 training-set peptides. (E) ROC curves for three versions of the MDSM, obtained with the test set of 48 peptides. The best performance was obtained after smoothing over both PDZ domains and amino acids. The performance of each version of the MDSM with m set to 5 is indicated with an arrow.
Fig. 3
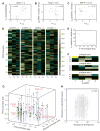
(A to C) Correlations between z scales and model parameters at position −4 for three PDZ domains. (A) _z_1 positively correlates with θ−4,q for Dlgh3 (1/1). (B) _z_2 negatively correlates with θ−4,q for Magi-1 (4/6). (C) _z_3 negatively correlates with θ−4,q for MUPP1 (10/13). (D) Correlation matrix between the model parameters for all 74 PDZ domains at positions −4, −3, −2, and −1 and the first three z scales of the amino acids. (E) Percentage of variance in the correlation matrix that is explained by the 12 principal axes identified through singular-value decomposition. (F) Graphical representation of the first three principal axes, used to define PDZ domain selectivity space. (G) Distribution of the 74 PDZ domains in selectivity space. Selected PDZ domains are shown, representing class I domains [PSD-95 (1/3) and Shank3 (1/1)], class II domains [Grip1 (6/7) and PDZ-RGS3 (1/1)], and class III domains [nNOS (1/1)]. Erbin (1/1), which has been described as a dual-specificity domain, lies between the class I and class II domains. (H) Correlation between pairwise sequence divergence of PDZ domains and their pairwise distances in selectivity space. Sequence divergence was obtained from pairwise alignments performed with Vector NTI version 8 (InforMax, Invitrogen Life Science Software, Frederick, Maryland), using the blosum62mt2 matrix. Pairwise distances in selectivity space are Euclidean distances obtained from the three-dimensional plot in (G).
Similar articles
- Cluster based prediction of PDZ-peptide interactions.
Kundu K, Backofen R. Kundu K, et al. BMC Genomics. 2014;15 Suppl 1(Suppl 1):S5. doi: 10.1186/1471-2164-15-S1-S5. Epub 2014 Jan 24. BMC Genomics. 2014. PMID: 24564547 Free PMC article. - Proteome scanning to predict PDZ domain interactions using support vector machines.
Hui S, Bader GD. Hui S, et al. BMC Bioinformatics. 2010 Oct 12;11:507. doi: 10.1186/1471-2105-11-507. BMC Bioinformatics. 2010. PMID: 20939902 Free PMC article. - A systematic family-wide investigation reveals that ~30% of mammalian PDZ domains engage in PDZ-PDZ interactions.
Chang BH, Gujral TS, Karp ES, BuKhalid R, Grantcharova VP, MacBeath G. Chang BH, et al. Chem Biol. 2011 Sep 23;18(9):1143-52. doi: 10.1016/j.chembiol.2011.06.013. Chem Biol. 2011. PMID: 21944753 Free PMC article. - PDZ domain proteins: 'dark matter' of the plant proteome?
Gardiner J, Overall R, Marc J. Gardiner J, et al. Mol Plant. 2011 Nov;4(6):933-7. doi: 10.1093/mp/ssr043. Epub 2011 Jun 7. Mol Plant. 2011. PMID: 21653283 Review. - Predicted amino acid motif repeats in proteins potentially encode extensive multivalent macromolecular assemblies in the human proteome.
Kelil A, Michnick SW. Kelil A, et al. Curr Opin Struct Biol. 2019 Feb;54:171-178. doi: 10.1016/j.sbi.2019.01.026. Epub 2019 Apr 9. Curr Opin Struct Biol. 2019. PMID: 30978654 Review.
Cited by
- The role of flexibility and conformational selection in the binding promiscuity of PDZ domains.
Münz M, Hein J, Biggin PC. Münz M, et al. PLoS Comput Biol. 2012;8(11):e1002749. doi: 10.1371/journal.pcbi.1002749. Epub 2012 Nov 1. PLoS Comput Biol. 2012. PMID: 23133356 Free PMC article. - Stereochemical determinants of C-terminal specificity in PDZ peptide-binding domains: a novel contribution of the carboxylate-binding loop.
Amacher JF, Cushing PR, Bahl CD, Beck T, Madden DR. Amacher JF, et al. J Biol Chem. 2013 Feb 15;288(7):5114-26. doi: 10.1074/jbc.M112.401588. Epub 2012 Dec 15. J Biol Chem. 2013. PMID: 23243314 Free PMC article. - PDZ domain-containing 1 (PDZK1) protein regulates phospholipase C-β3 (PLC-β3)-specific activation of somatostatin by forming a ternary complex with PLC-β3 and somatostatin receptors.
Kim JK, Kwon O, Kim J, Kim EK, Park HK, Lee JE, Kim KL, Choi JW, Lim S, Seok H, Lee-Kwon W, Choi JH, Kang BH, Kim S, Ryu SH, Suh PG. Kim JK, et al. J Biol Chem. 2012 Jun 15;287(25):21012-24. doi: 10.1074/jbc.M111.337865. Epub 2012 Apr 23. J Biol Chem. 2012. PMID: 22528496 Free PMC article. - The thermostability and specificity of ancient proteins.
Wheeler LC, Lim SA, Marqusee S, Harms MJ. Wheeler LC, et al. Curr Opin Struct Biol. 2016 Jun;38:37-43. doi: 10.1016/j.sbi.2016.05.015. Epub 2016 Jun 9. Curr Opin Struct Biol. 2016. PMID: 27288744 Free PMC article. Review. - Structure-based optimization of a PDZ-binding motif within a viral peptide stimulates neurite outgrowth.
Khan Z, Terrien E, Delhommel F, Lefebvre-Omar C, Bohl D, Vitry S, Bernard C, Ramirez J, Chaffotte A, Ricquier K, Vincentelli R, Buc H, Prehaud C, Wolff N, Lafon M. Khan Z, et al. J Biol Chem. 2019 Sep 13;294(37):13755-13768. doi: 10.1074/jbc.RA119.008238. Epub 2019 Jul 25. J Biol Chem. 2019. PMID: 31346033 Free PMC article.
References
- Pawson T. Nature. 1995;373:573. - PubMed
- Pawson T, Nash P. Science. 2003;300:445. - PubMed
- Kim E, Niethammer M, Rothschild A, Jan YN, Sheng M. Nature. 1995;378:85. - PubMed
- Kornau HC, Schenker LT, Kennedy MB, Seeburg PH. Science. 1995;269:1737. - PubMed
- Nourry C, Grant SGN, Borg J-P. Sci STKE. 2003;2003:re7. - PubMed
Publication types
MeSH terms
Substances
Grants and funding
- R01 GM072872/GM/NIGMS NIH HHS/United States
- R01 GM072872-04/GM/NIGMS NIH HHS/United States
- 1 RO1 GM072872-01/GM/NIGMS NIH HHS/United States
- 5 T32 GM07598-25/GM/NIGMS NIH HHS/United States
LinkOut - more resources
Full Text Sources
Other Literature Sources
Research Materials


