Cell size and invasion in TGF-beta-induced epithelial to mesenchymal transition is regulated by activation of the mTOR pathway - PubMed (original) (raw)
Cell size and invasion in TGF-beta-induced epithelial to mesenchymal transition is regulated by activation of the mTOR pathway
Samy Lamouille et al. J Cell Biol. 2007.
Abstract
Epithelial to mesenchymal transition (EMT) occurs during development and cancer progression to metastasis and results in enhanced cell motility and invasion. Transforming growth factor-beta (TGF-beta) induces EMT through Smads, leading to transcriptional regulation, and through non-Smad pathways. We observe that TGF-beta induces increased cell size and protein content during EMT. This translational regulation results from activation by TGF-beta of mammalian target of rapamycin (mTOR) through phosphatidylinositol 3-kinase and Akt, leading to the phosphorylation of S6 kinase 1 and eukaryotic initiation factor 4E-binding protein 1, which are direct regulators of translation initiation. Rapamycin, a specific inhibitor of mTOR complex 1, inhibits the TGF-beta-induced translation pathway and increase in cell size without affecting the EMT phenotype. Additionally, rapamycin decreases the migratory and invasive behavior of cells that accompany TGF-beta-induced EMT. The TGF-beta-induced translation pathway through mTOR complements the transcription pathway through Smads. Activation of mTOR by TGF-beta, which leads to increased cell size and invasion, adds to the role of TGF-beta-induced EMT in cancer progression and may represent a therapeutic opportunity for rapamycin analogues in cancer.
Figures
Figure 1.
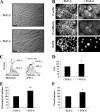
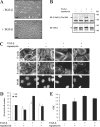
Increase in cell size and protein content during the TGF-β–induced EMT in NMuMG cells. (A) Cells were treated or not treated with TGF-β for 48 h before photography. Original magnification was 40×. See Videos 1 and 2 (available at
http://www.jcb.org/cgi/content/full/jcb.200611146/DC1
). (B) Cells treated or not treated with TGF-β for 48 h were stained for F-actin or E-cadherin. Nuclei were visualized using DAPI staining. Original magnification was 100×. (C) After 48 h of TGF-β treatment or no treatment, the cell cycle distribution was determined by flow cytometry analysis (left), and the size distribution of cells in G1 phase was determined by flow cytometry using the forward scatter parameter (FSC; right). (D) Quantification of the forward scatter normalized to untreated cells shows relative mean values of one representative experiment out of seven with SD (error bars) for duplicates (*, P < 0.05 vs. control). (E) 24 h after adding TGF-β, the total protein content was measured and normalized for cell number, as shown relative to untreated cells. One representative experiment out of five is shown with SD for triplicates (**, P < 0.01 vs. control). (F) 24 h after adding TGF-β, cells were [35S]-methionine/cysteine labeled, and trichloroacetic acid–precipitated proteins were quantified. The newly synthesized protein value is normalized to the cell number and shown relative to untreated cells. One out of two representative experiments is shown with SD for triplicates (*, P < 0.05 vs. control). Bars (A), 50 μm; (B) 20 μm.
Figure 2.
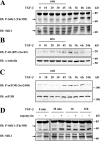
TGF-β induces mTOR, S6K1, and 4E-BP1 phosphorylation. (A–C) NMuMG cells were treated with TGF-β for the indicated times before lysis, SDS-PAGE, and immunoblotting (IB) with an antibody to phospho-S6K1 (A), phospho–4E-BP1 or α-tubulin (B), or phospho-mTOR (C). The phospho-S6K1 and phospho-mTOR immunoblots were reprobed with S6K1 and mTOR antibody, respectively. (D) NMuMG cells were pretreated without or with rapamycin for 1 h, and TGF-β was added for the indicated times. Cell lysates were separated by SDS-PAGE and immunoblotted with phospho-S6K1 antibody, stripped, and reblotted with S6K1 antibody.
Figure 3.
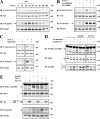
The TGF-β–induced mTOR pathway is activated by TβRI, PI3K, and Akt. (A) NMuMG cells were stimulated with TGF-β for the indicated times. Cell lysates were separated by SDS-PAGE and subjected to immunoblotting (IB) with phospho-Akt or phospho-Smad3/Smad1 antibodies and subsequent reblotting with Akt or Smad3 antibodies, respectively. (B) NMuMG cells were pretreated without or with wortmannin or LY294002 for 1 h, and TGF-β was added or not added to the medium for 1 h. Cell lysates were immunoblotted with antibodies to phospho-Akt or phospho-Smad3/Smad1 and reblotted with antibodies to Akt or Smad3, respectively. (C) NMuMG cells were treated without or with SB431542 for 1 h, and TGF-β was added or not added to the medium for 1 h. Cell lysates were immunoblotted with antibodies to phospho-Akt or phospho-Smad3/Smad1 and reprobed with antibodies to Akt or Smad3, respectively. (D) NMuMG cells were treated with or without rapamycin or wortmannin for 1 h, and TGF-β or 5 μg/ml insulin was added or not added to the medium for 1 h. Cell lysates were immunoblotted with antibodies to phospho-S6K1 or 4E-BP1 and reprobed with S6K1 antibody. (E) NMuMG cells were transfected to express a dominant-negative Akt mutant with Ser473 and Thr308 substituted by alanines. Cells were stimulated or not stimulated with TGF-β or 5 μg/ml insulin for 1 h. Cell lysates were immunoblotted with antibodies to phospho-S6K1, Akt, or phospho-Smad3/Smad1; phospho-S6K1 and phospho-Smad3/Smad1 immunoblots were reprobed with S6K1 or Smad3 antibodies, respectively.
Figure 4.
Effect of rapamycin on TGF-β–induced cell size and protein synthesis of NMuMG cells. (A and B) Cells were pretreated with or without rapamycin (A) or SB431542 (B) for 1 h, and TGF-β was added or not added to the medium for 48 h. The cell cycle distribution was determined by flow cytometry (left), and the size distribution of cells in G1 phase was determined by flow cytometry using the forward scatter parameter (FSC; right). The numbers represent the mean forward scatter percentage of cell size increase (+) or decrease (−) normalized to untreated cells. One representative experiment out of two independent experiments is shown with SD (error bars) for triplicates. (C and D) Cells were pretreated with or without rapamycin (C) or SB431542 (D) for 1 h, and TGF-β was added or not added to the medium. After 24 h, the cells were trypsinized, and the cell number was determined. The total protein content normalized for cell number is shown relative to untreated cells. One representative experiment out of two independent experiments is shown with SD for triplicates (**, P < 0.01).
Figure 5.
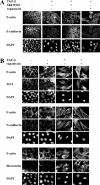
Effect of rapamycin on TGF-β– induced EMT. (A) NMuMG cells were treated with or without rapamycin or SB431542 for 1 h, and TGF-β was added or not added to the medium. After 48 h, the cells were stained for F-actin and E-cadherin. DAPI was used to stain the nuclei. Original magnification was 100×. (B) Cells were treated with or without rapamycin for 1 h, and TGF-β was added or not added to the medium. After 48 h, the cells were stained for F-actin, ZO-1, N-cadherin, or fibronectin. DAPI was used to stain the nuclei. Original magnification was 100×. Bars (A), 20 μm; (B) 10 μm.
Figure 6.
TGF-β activates the mTOR pathway during EMT in HaCaT cells. (A) Cells were treated or not treated with TGF-β for 72 h before photography. Original magnification was 20×. (B) HaCaT cells were pretreated with or without rapamycin for 1 h, and TGF-β was added or not added to the medium for 1 h. Cell lysates were separated by SDS-PAGE and immunoblotted (IB) with phospho-S6K1 antibody. The filter was then stripped and reblotted with S6K1 antibody. (C) Cells were treated with or without rapamycin for 1 h, and TGF-β was added or not added to the medium. After 72 h, the cells were stained for F-actin and E-cadherin. DAPI was used to stain the nuclei. Original magnification was 100×. (D) Cells were pretreated without or with rapamycin for 1 h, and TGF-β was added or not added to the medium. After 24 and 48 h, the cells were trypsinized, and the cell number was determined. The total protein content normalized for cell number is shown relative to untreated cells. One experiment out of two independent experiments is shown with SD (error bars) for triplicates. (E) Cells were pretreated without or with rapamycin for 1 h, and TGF-β was added or not added to the medium for 72 h. The size distribution of cells in G1 phase was determined by flow cytometry using the forward scatter (FSC) parameter. Quantification of the FSC normalized to untreated cells shows relative mean values of one experiment out of two with SD for triplicates. Bars (A), 50 μm; (C) 10 μm.
Figure 7.
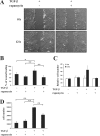
Effect of rapamycin on migration and adhesion of NMuMG cells after TGF-β–induced EMT. (A) Cells were treated with or without rapamycin for 1 h, and TGF-β was added or not added to the medium for 48 h. The cell monolayer was then scratched to create a wound, and the migration of the cells was observed by time-lapse microscopy and photography at 0 and 12 h after wounding. Original magnification was 10×. See Videos 3 and 4 (available at
http://www.jcb.org/cgi/content/full/jcb.200611146/DC1
. (B) The percentage of wound healing was calculated from the mean of eight wound widths per condition with SD (error bars) measured at 12 h. One representative experiment out of three independent experiments is shown (*, P < 0.05; **, P < 0.01). (C) Cells were treated with or without rapamycin for 1 h, and TGF-β was added or not added to the medium. After 36 h, the fluorophore DiI was added for an additional 12 h. The cells were then trypsinized and placed in transwell filter chambers. Fluorescent measurements of migration of DiI-labeled cells through the transwell membrane were taken at 6 and 24 h. The result shows one representative experiment out of two independent experiments with SD for triplicates. (D) Cells were treated with or without rapamycin for 1 h, and TGF-β was added or not added to the medium. After 48 h, the cells were trypsinized and reseeded on plastic culture plates, and nonadherent cells were removed by washing the plates with PBS at 30 min after reseeding. The number of adherent cells was determined. One representative experiment out of two independent experiments is shown with SD for triplicates (**, P < 0.01). Bar, 200 μm.
Figure 8.
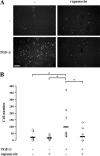
Effect of rapamycin on the invasion of NMuMG cells after TGF-β–induced EMT. NMuMG cells were treated with or without rapamycin for 1 h, and TGF-β was added or not added to the medium. After 48 h, cells were trypsinized and placed in Matrigel-coated transwell filter chambers and incubated for 24 h. The noninvading cells were removed from the upper surface of the membrane, cells that adhered to the lower surface were fixed, and the nuclei were stained with DAPI. (A) Photography of the DAPI staining using fluorescence microscopy. The result shows a field of one filter per condition in one representative experiment out of three independent experiments. Original magnification was 10×. (B) The DAPI-stained nuclei were counted in four fields per filter in triplicate in one representative experiment out of three independent experiments (*, P < 0.05). The horizontal bars represent the cell number mean of 12 fields for each condition. Bar, 200 μm.
Figure 9.
Divergent TGF-β signaling pathways induce transcriptional regulation through Smads and translational regulation through the mTORC1 pathway.
Similar articles
- Transforming Growth Factor β1-induced Apoptosis in Podocytes via the Extracellular Signal-regulated Kinase-Mammalian Target of Rapamycin Complex 1-NADPH Oxidase 4 Axis.
Das R, Xu S, Nguyen TT, Quan X, Choi SK, Kim SJ, Lee EY, Cha SK, Park KS. Das R, et al. J Biol Chem. 2015 Dec 25;290(52):30830-42. doi: 10.1074/jbc.M115.703116. Epub 2015 Nov 12. J Biol Chem. 2015. PMID: 26565025 Free PMC article. - Metformin Inhibits TGF-β1-Induced Epithelial-to-Mesenchymal Transition via PKM2 Relative-mTOR/p70s6k Signaling Pathway in Cervical Carcinoma Cells.
Cheng K, Hao M. Cheng K, et al. Int J Mol Sci. 2016 Nov 30;17(12):2000. doi: 10.3390/ijms17122000. Int J Mol Sci. 2016. PMID: 27916907 Free PMC article. - Multiple transforming growth factor-beta isoforms and receptors function during epithelial-mesenchymal cell transformation in the embryonic heart.
Mercado-Pimentel ME, Runyan RB. Mercado-Pimentel ME, et al. Cells Tissues Organs. 2007;185(1-3):146-56. doi: 10.1159/000101315. Cells Tissues Organs. 2007. PMID: 17587820 Review. - [Aberrant Activation Mechanism of TGF-β Signaling in Epithelial-mesenchymal Transition].
Yuki R. Yuki R. Yakugaku Zasshi. 2021;141(11):1229-1234. doi: 10.1248/yakushi.21-00143. Yakugaku Zasshi. 2021. PMID: 34719542 Review. Japanese.
Cited by
- Epstein-Barr Virus-Encoded Latent Membrane Protein 2A Downregulates GCNT3 via the TGF-β1/Smad-mTORC1 Signaling Axis.
Liu J, Zhang Y, Yu C, Li J, Liu W, Luo B. Liu J, et al. J Virol. 2021 Apr 26;95(10):e02481-20. doi: 10.1128/JVI.02481-20. Epub 2021 Mar 3. J Virol. 2021. PMID: 33658337 Free PMC article. - FBXW7 suppresses epithelial-mesenchymal transition, stemness and metastatic potential of cholangiocarcinoma cells.
Yang H, Lu X, Liu Z, Chen L, Xu Y, Wang Y, Wei G, Chen Y. Yang H, et al. Oncotarget. 2015 Mar 20;6(8):6310-25. doi: 10.18632/oncotarget.3355. Oncotarget. 2015. PMID: 25749036 Free PMC article. - MicroRNA-33a regulates cholesterol synthesis and cholesterol efflux-related genes in osteoarthritic chondrocytes.
Kostopoulou F, Malizos KN, Papathanasiou I, Tsezou A. Kostopoulou F, et al. Arthritis Res Ther. 2015 Mar 5;17(1):42. doi: 10.1186/s13075-015-0556-y. Arthritis Res Ther. 2015. PMID: 25880168 Free PMC article. - Signaling pathways promoting epithelial mesenchymal transition in oral submucous fibrosis and oral squamous cell carcinoma.
Shetty SS, Sharma M, Fonseca FP, Jayaram P, Tanwar AS, Kabekkodu SP, Kapaettu S, Radhakrishnan R. Shetty SS, et al. Jpn Dent Sci Rev. 2020 Nov;56(1):97-108. doi: 10.1016/j.jdsr.2020.07.002. Epub 2020 Aug 22. Jpn Dent Sci Rev. 2020. PMID: 32874377 Free PMC article. Review. - TGFβ Signaling in Tumor Initiation, Epithelial-to-Mesenchymal Transition, and Metastasis.
Papageorgis P. Papageorgis P. J Oncol. 2015;2015:587193. doi: 10.1155/2015/587193. Epub 2015 Mar 25. J Oncol. 2015. PMID: 25883652 Free PMC article. Review.
References
- Aguilera, A., L.S. Aroeira, M. Ramirez-Huesca, M.L. Perez-Lozano, A. Cirugeda, M.A. Bajo, G. Del Peso, A. Valenzuela-Fernandez, J.A. Sanchez-Tomero, M. Lopez-Cabrera, and R. Selgas. 2005. Effects of rapamycin on the epithelial-to-mesenchymal transition of human peritoneal mesothelial cells. Int. J. Artif. Organs. 28:164–169. - PubMed
- Albini, A., R. Benelli, D.M. Noonan, and C. Brigati. 2004. The “chemoinvasion assay”: a tool to study tumor and endothelial cell invasion of basement membranes. Int. J. Dev. Biol. 48:563–571. - PubMed
- Angers-Loustau, A., J.F. Cote, and M.L. Tremblay. 1999. Roles of protein tyrosine phosphatases in cell migration and adhesion. Biochem. Cell Biol. 77:493–505. - PubMed
- Arteaga, C.L. 2006. Inhibition of TGFβ signaling in cancer therapy. Curr. Opin. Genet. Dev. 16:30–37. - PubMed
- Bakin, A.V., A.K. Tomlinson, N.A. Bhowmick, H.L. Moses, and C.L. Arteaga. 2000. Phosphatidylinositol 3-kinase function is required for transforming growth factor β-mediated epithelial to mesenchymal transition and cell migration. J. Biol. Chem. 275:36803–36810. - PubMed
Publication types
MeSH terms
Substances
LinkOut - more resources
Full Text Sources
Other Literature Sources
Molecular Biology Databases
Research Materials
Miscellaneous
