Intracellular crowding defines the mode and sequence of substrate uptake by Escherichia coli and constrains its metabolic activity - PubMed (original) (raw)
Intracellular crowding defines the mode and sequence of substrate uptake by Escherichia coli and constrains its metabolic activity
Q K Beg et al. Proc Natl Acad Sci U S A. 2007.
Abstract
The influence of the high intracellular concentration of macromolecules on cell physiology is increasingly appreciated, but its impact on system-level cellular functions remains poorly quantified. To assess its potential effect, here we develop a flux balance model of Escherichia coli cell metabolism that takes into account a systems-level constraint for the concentration of enzymes catalyzing the various metabolic reactions in the crowded cytoplasm. We demonstrate that the model's predictions for the relative maximum growth rate of wild-type and mutant E. coli cells in single substrate-limited media, and the sequence and mode of substrate uptake and utilization from a complex medium are in good agreement with subsequent experimental observations. These results suggest that molecular crowding represents a bound on the achievable functional states of a metabolic network, and they indicate that models incorporating this constraint can systematically identify alterations in cellular metabolism activated in response to environmental change.
Conflict of interest statement
The authors declare no conflict of interest.
Figures
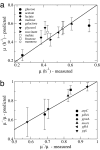
Fig. 1.
Predicted and measured maximal growth rates comparison. (a) Comparison between the predicted (y axis) and measured (x axis) growth rates μ of E. coli MG1655 grown in M9 minimal medium with various carbon sources. For a perfect match between experiments and theory the symbols should fall on the black diagonal. The symbols indicate the carbon substrate identified in the key. The predicted growth rates were obtained by using 〈_a_〉 = 0.0040 h·g/mmol (see
SI Text
sections S1 and S2). The error bars represent standard deviation over 1,000 sets of specific _a_i parameters. (b) Same plot for single gene deletion E. coli mutants growing in glucose, the deleted genes being indicated in the key. The mutant growth rates μ− are given relative to the predicted and measured maximal growth rate μ of wild-type E. coli cells growing in glucose-limited medium.
Fig. 2.
E. coli growth profile and predicted vs. measured hierarchy of substrate utilization. (a) The absolute concentration (black curve) and maximal growth rates (green curve) of a batch culture of E. coli cells grown in M9 minimal medium containing an equal ratio of glucose, maltose, galactose, glycerol, and lactate are shown, together with the pH (blue curve) and oxygen concentration, pO2 (red curve). (b) The measured concentration of the indicated carbon sources in the growth medium. The growth experiments were performed in triplicate (
SI Fig. 8
), and means and standard deviations are shown here. The three substrate utilization phases, phase 1 (exclusive glucose), phase 2 (mixed substrates), and phase 3 (glycerol and acetate), are indicated in light blue, purple, and white backgrounds, respectively. (c) Predicted substrate uptakes from the growth medium based on the FBAwMC model. The color coding for substrate utilization curves is identical in b and c, and the error bars represent the standard deviations of the data analyzed from the samples collected from three individual bioreactor runs (
SI Fig. 8
).
Fig. 3.
Comparison between the gene expression profiles and predicted substrate uptake rates. The upper panel in each pair of graphs represents the measured relative gene expression profiles as a function of time (in hours). The lower panels represent the predicted substrate uptake profiles (mmol/min·g) also as a function of time (in hours). Of the carbon sources present in the original growth medium (red), the uptake and entry points of glucose, maltose, galactose, glycerol, and lactate into the E. coli glycolytic pathway and citric acid cycle are shown in the diagrammed metabolic pathways. Acetate (purple) is initially produced and later consumed by E. coli cells growing in batch culture. All other substrates are shown in black, and the genes encoding various enzymes catalyzing the transport and degradation of intermediary substrates are also italicized. The description of genes responsible for uptake and utilization of listed carbon sources, their biological roles, and description of substrate entry mechanisms are detailed in
SI Table 1
. mRNA expression profiles of genes encoding metabolic transporters and enzymes specifically involved in galactose, glucose, glycerol, lactate, acetate, and maltose metabolism are shown. The detailed profiles and the full microarray data are presented in the
SI Dataset 3
. Gene expression values (on y axis) in the time series microarray data are the calculated fold changes for each time point relative to the geometric mean of the hybridization intensity of all time points for each gene and are expressed as log2. The low values represent lower gene expression, and higher values represent higher gene expression.
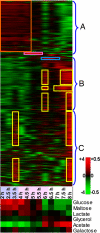
Fig. 4.
Analysis of microarray expression data. (Upper) Hierarchical clustering with optimal leaf ordering (31) identifies three major expression modes. Relative gene expression values from the highest (red) to the lowest (green) are shown, as indicated by the left side of the color scale bar (+4 to −4). Expression mode A: genes that are up-regulated until 4.5 h (red box). Expression mode B: genes with peak expression at 6 h and after 7.5 h. Expression mode C: genes with peaks at 3.5 h and after 7.5 h. See the GO analysis of these three expression modes in
SI Figs. 16–18
. The purple and blue boxes indicate up-regulation of maltose and glycerol regulons, respectively. The temporal order of the three phases of substrate utilization is shown in light blue, purple, and white shades (as in Fig. 2). (Lower) Matrix comparing the overall correlation of expression profiles at the given time points with that of obtained in mid-logarithmic batch cultures of the indicated single carbon-limited media, as indicated by the right side of the color scale bar [+0.5 (red–high) and −0.5 (green–low)].
Similar articles
- Carbon catabolite repression correlates with the maintenance of near invariant molecular crowding in proliferating E. coli cells.
Zhou Y, Vazquez A, Wise A, Warita T, Warita K, Bar-Joseph Z, Oltvai ZN. Zhou Y, et al. BMC Syst Biol. 2013 Dec 12;7:138. doi: 10.1186/1752-0509-7-138. BMC Syst Biol. 2013. PMID: 24330501 Free PMC article. - Impact of the solvent capacity constraint on E. coli metabolism.
Vazquez A, Beg QK, Demenezes MA, Ernst J, Bar-Joseph Z, Barabási AL, Boros LG, Oltvai ZN. Vazquez A, et al. BMC Syst Biol. 2008 Jan 23;2:7. doi: 10.1186/1752-0509-2-7. BMC Syst Biol. 2008. PMID: 18215292 Free PMC article. - Growth of Escherichia coli MG1655 on LB medium: determining metabolic strategy with transcriptional microarrays.
Baev MV, Baev D, Radek AJ, Campbell JW. Baev MV, et al. Appl Microbiol Biotechnol. 2006 Jul;71(3):323-8. doi: 10.1007/s00253-006-0392-8. Epub 2006 Apr 28. Appl Microbiol Biotechnol. 2006. PMID: 16645822 - Gene expression analysis of the response by Escherichia coli to seawater.
Rozen Y, Larossa RA, Templeton LJ, Smulski DR, Belkin S. Rozen Y, et al. Antonie Van Leeuwenhoek. 2002 Aug;81(1-4):15-25. doi: 10.1023/a:1020500821856. Antonie Van Leeuwenhoek. 2002. PMID: 12448701 Review. - Flux analysis and control of the central metabolic pathways in Escherichia coli.
Holms H. Holms H. FEMS Microbiol Rev. 1996 Dec;19(2):85-116. doi: 10.1111/j.1574-6976.1996.tb00255.x. FEMS Microbiol Rev. 1996. PMID: 8988566 Review.
Cited by
- A novel yeast hybrid modeling framework integrating Boolean and enzyme-constrained networks enables exploration of the interplay between signaling and metabolism.
Österberg L, Domenzain I, Münch J, Nielsen J, Hohmann S, Cvijovic M. Österberg L, et al. PLoS Comput Biol. 2021 Apr 9;17(4):e1008891. doi: 10.1371/journal.pcbi.1008891. eCollection 2021 Apr. PLoS Comput Biol. 2021. PMID: 33836000 Free PMC article. - Cell Geometry and Membrane Protein Crowding Constrain Growth Rate, Overflow Metabolism, Respiration, and Maintenance Energy.
Carlson RP, Beck AE, Benitez MG, Harcombe WR, Mahadevan R, Gedeon T. Carlson RP, et al. bioRxiv [Preprint]. 2024 Aug 22:2024.08.21.609071. doi: 10.1101/2024.08.21.609071. bioRxiv. 2024. PMID: 39229203 Free PMC article. Preprint. - Individualized therapy of HHT driven by network analysis of metabolomic profiles.
Jamshidi N, Miller FJ, Mandel J, Evans T, Kuo MD. Jamshidi N, et al. BMC Syst Biol. 2011 Dec 20;5:200. doi: 10.1186/1752-0509-5-200. BMC Syst Biol. 2011. PMID: 22185482 Free PMC article. - Integration of enzymatic data in Bacillus subtilis genome-scale metabolic model improves phenotype predictions and enables in silico design of poly-γ-glutamic acid production strains.
Massaiu I, Pasotti L, Sonnenschein N, Rama E, Cavaletti M, Magni P, Calvio C, Herrgård MJ. Massaiu I, et al. Microb Cell Fact. 2019 Jan 9;18(1):3. doi: 10.1186/s12934-018-1052-2. Microb Cell Fact. 2019. PMID: 30626384 Free PMC article. - Network reduction methods for genome-scale metabolic models.
Singh D, Lercher MJ. Singh D, et al. Cell Mol Life Sci. 2020 Feb;77(3):481-488. doi: 10.1007/s00018-019-03383-z. Epub 2019 Nov 20. Cell Mol Life Sci. 2020. PMID: 31748914 Free PMC article. Review.
References
- Hatzimanikatis V, Li C, Ionita JA, Henry CS, Jankowski MD, Broadbelt LJ. Curr Opin Struct Biol. 2004;14:300–306. - PubMed
- Barabási A-L, Oltvai ZN. Nat Rev Genet. 2004;5:101–113. - PubMed
- Price ND, Reed JL, Palsson BO. Nat Rev Microbiol. 2004;2:886–897. - PubMed
Publication types
MeSH terms
Substances
LinkOut - more resources
Full Text Sources
Other Literature Sources


