Cholinergic forebrain degeneration in the APPswe/PS1DeltaE9 transgenic mouse - PubMed (original) (raw)
Cholinergic forebrain degeneration in the APPswe/PS1DeltaE9 transgenic mouse
Sylvia E Perez et al. Neurobiol Dis. 2007 Oct.
Abstract
The impact of Abeta deposition upon cholinergic intrinsic cortical and striatal, as well as basal forebrain long projection neuronal systems was qualitatively and quantitatively evaluated in young (2-6 months) and middle-aged (10-16 months) APPswe/PS1DeltaE9 transgenic (tg) mice. Cholinergic neuritic swellings occurred as early as 2-3 months of age in the cortex and hippocampus and 5-6 months in the striatum of tg mice. However, cholinergic neuron number or choline acetyltransferase (ChAT) optical density measurements remained unchanged in the forebrain structures with age in APPswe/PS1DeltaE9 tg mice. ChAT enzyme activity decreased significantly in the cortex and hippocampus of middle-aged tg mice. These results suggest that Abeta deposition has age-dependent effects on cortical and hippocampal ChAT fiber networks and enzyme activity, but does not impact the survival of cholinergic intrinsic or long projection forebrain neurons in APPswe/PS1DeltaE9 tg mice.
Figures
Figure 1
A-E, Rostral to caudal diagrams showing transverse sections delimitating the level and borders (dotted-lines) outlining the regions of the motor, cingulate and sensory cortices as well as the striatum and nucleus basalis processed for stereology in APPswe/PS1ΔE9 tg and ntg mice. A, amygdala complex; B, nucleus basalis; BST, bed nucleus of the stria terminalis; Cg, cingulate cortex; DG, dentate gyrus; Ect, ectorhinal cortex; Ent, entorhinal cortex; fi, fimbria; G, geniculate nucleus; GP, globus pallidus; HB, horizontal limb of the diagonal band of Broca; HC, hippocampus; I, insular cortex; ic, internal capsule; IP, interpeduncular nucleus; LH, lateral hypothalamic area; lo, lateral olfactory tract; LV, lateral ventricle; M, motor cortex; ml, medial lemniscus; opt, optic tract; St, striatum; Pir, piriform cortex; R, red nucleus; RS, retrosplenial cortex, S, sensory cortex; SC, superior colliculus; SI/B, substantia innominata/nucleus basalis; sm, stria medullaris thalami; SN, substantia nigra; Th, thalamus.
Figure 2
Fluorescence images showing the age-related Aβ deposition in the cortex and hippocampus in an APPswe/PS1ΔE9 tg mouse. A-D, coronal sections showing a few Aβ-ir plaques in the motor (A), cingulate (A) and parietal (B) cortices of a 3-month-old APPswe/PS1ΔE9 tg mouse (white arrowheads), whereas at 10 and 16 months of age extensive Aβ-ir deposition is seen in these areas (B,C,E,F) including in the hippocampal formation (E,F) in tg mice. Note the intense accumulation of Aβ-ir plaques in the dentate gyrus (E,F; white arrows). Au, Auditory cortex; Cg, cingulate cortex; DG, dentate gyrus; M, motor cortex; PP, posterior parietal association area; St, striatum; Vi, visual cortex. mos, months. Scale bars: A,D=50μm; B,C,E,D=200μm.
Figure 3
Bright-field photos showing examples of swollen ChAT-ir and AChE (B,H) positive dystrophic neurites forming rosette (A,C,E,F,K) and grape (E; arrow) -like patterns, other dystrophic morphologies (D,G,I,J,L,K) in the cerebral cortex, hippocampus and striatum of 3-16-month-old double mutant mice. Note that the voluptuousness appearance and number of ChAT-ir dystrophic neurites increase with age (A,C,F,G), as well as the alterations in non-dystrophic ChAT-ir fiber trajectories in close proximities to dystrophic clusters (A,D,I; arrowheads) probably due to the presence of Aβ-plaque deposition. Scale bars=20μm.
Figure 4
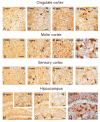
Photographs of coronal sections of the cingulate (A-D), motor (E-H) and sensory (visual (I, J) and parietal (K, L) cortices showing the healthy morphology of ChAT-ir interneurons and the disruption of the ChAT-ir fiber network in 3-16-month-old APPswe/PS1ΔE9 tg and ntg mice. Note the presence of few ChAT-ir dystrophic neurite-clusters in a 3-month-old tg mouse (B,F,J), whereas many more are seen at 16 months of age (D,H,L), as well as the dramatic disturbance in cholinergic fiber trajectory (D, L) and decrease in ChAT-ir fiber density in these cortices in a 16 months of age tg mouse compared to ntg mouse (C,K,D,L). H, Section of the motor cortex of a 16-month-old APPswe/PS1ΔE9 tg mouse showing Aβ-ir plaques (red) and ChAT-ir fibers and neuron (blue). Note that cholinergic neuronal morphology (white arrowhead) appears intact despite close proximity to Aβ-ir plaques. M-P. Coronal sections illustrating the decrease in the ChAT-ir fibers in the hippocampus and the presence the dystrophic neurites (arrowheads) in a 16-month-old tg mouse. N, P, Insets showing detail of the ChAT-ir innervation in the dentate gyrus from M and O, respectively. Q, Coronal section of the hippocampus of a 16-months-old tg mouse showing numerous Aβ-ir plaques (red) mainly in the dentate gyrus and/or associated swollen ChAT-ir dystrophic neurites (blue; arrowheads) and ChAT-ir fiber distribution (blue) compared to a ntg mouse (M). No ChAT-ir dystrophic neurites or decrease in cholinergic fiber density was observed in the cortex and hippocampus of ntg mouse at any age (A,C,E,G,I,K,M). ntg, non-transgenic mice; tg, APPswe/PS1ΔE9 transgenic mice; mos, months. Scale bars: A-D, F-L, N,P=20μm; E,M,O,Q=50μm.
Figure 5
Photographs showing lamina disturbances of cholinergic fiber innervation of the somatosensory cortex in 3- and 16-month-old tg mice (B,D) compared to ntg mice (A,C). There was no age-related alteration in the laminar distribution of cholinergic fibers in the somatosensory cortex between young and aged ntg mice. By contrast, there was an extensive disruption of the cholinergic fiber network and the presence of dystrophic neurites (arrowheads) in the somatosensory cortex between young and aged mutant mice. Cortical layers are indicated by the roman numerals I-VI; ntg, non-transgenic mice; tg, APPswe/PS1ΔE9 transgenic mice. Scale bar=150μm.
Figure 6
Photographs of the striatum and nucleus basalis showing the normal morphology of the ChAT-ir neurons and ChAT-ir dystrophic neurites in 3-, 6- and 16-month-old APPswe/PS1ΔE9 tg and ntg mice. A-F. Coronal sections of the striatum illustrating the presence of ChAT-ir dystrophic neurites at 6- and 16-month-old tg mice (arrowheads) compared with their absence in age-matched ntg mice (A, D). C,F, Insets showing detail of ChAT-ir dystrophic neurites from B and E, respectively. G-I, Coronal sections of the nucleus basalis showing the absence of dystrophic neurites in a 3-month-old double mutant mouse (H) as well as in 3- and 16-month-old ntg mice (G,I). J, Coronal section of the nucleus basalis showing a few Aβ-ir plaques (red; arrows) surrounded by ChAT-ir dystrophic neurites (dark blue) in a 16-month-old double mutant mice. K, Inset illustrating detail of swollen ChAT-ir dystrophic neurites (dark blue) in the vicinities of Aβ-ir plaques (red) in the nucleus basalis of a 16-month-old double tg mouse. ntg, non-transgenic mice; tg, APPswe/PS1ΔE9 transgenic mice; mos, months. Scale bars: A,B,D,E,G-J=50μm; C,E,K=20μm.
Figure 7
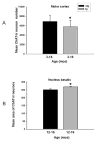
A. Histogram showing significant differences in the mean values of ChAT-ir neuronal number (asterisk) in the motor cortex of 3- to 16-month-old tg and age-matched ntg littermate mice (Mann-Whitney rank-sum test; p=0.033). B. Histogram showing the mean area of ChAT-ir neurons within the nucleus basalis of 12- to16-month-old tg and ntg mice. Mann-Whitney rank-sum test revealed significant increase (asterisk) in the mean area of cholinergic neurons in the nucleus basalis of the oldest APPswe/PS1ΔE9 tg compared to ntg mice (p=0.029). ntg, non-transgenic mice; tg, APPswe/PS1ΔE9 transgenic mice; error bars=standard deviation of the mean; mos, months.
Figure 8
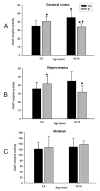
Histograms illustrating the mean values of the ChAT enzyme activity (μmol/hr/g protein) in the cerebral cortex, hippocampus and striatum of 2- to 6-month-old and 10- to 16-month-old tg mice and ntg. A, B, Statistical analysis revealed a significant decrease (asterisks) in cortical and hippocampal ChAT enzyme activity between 2-6- and 10-16-month-old APPswe/PS1ΔE9 tg mice (Mann-Whitney rank-sum test; cerebral cortex p=0.048, hippocampus p=0.035). Statistical evaluation also revealed significant differences (diamonds) in cortical ChAT enzyme activity at 10-16 months between APPswe/PS1ΔE9 tg and ntg mice, but not in the hippocampus (p=0.018). C, No significant differences in ChAT enzyme activity was detected in the striatum of the examined groups (Mann-Whitney rank-sum test; p<0.05). ntg, non-transgenic mice; tg, APPswe/PS1ΔE9 transgenic mice; error bars=standard deviation of the mean; mos, months.
Similar articles
- The presence of the APP(swe) mutation in mice does not increase the vulnerability of cholinergic basal forebrain neurons to neuroinflammation.
Wenk GL, McGann-Gramling K, Hauss-Wegrzyniak B. Wenk GL, et al. Neuroscience. 2004;125(3):769-76. doi: 10.1016/j.neuroscience.2004.01.050. Neuroscience. 2004. PMID: 15099690 - Beta-amyloid deposition and functional impairment in the retina of the APPswe/PS1DeltaE9 transgenic mouse model of Alzheimer's disease.
Perez SE, Lumayag S, Kovacs B, Mufson EJ, Xu S. Perez SE, et al. Invest Ophthalmol Vis Sci. 2009 Feb;50(2):793-800. doi: 10.1167/iovs.08-2384. Epub 2008 Sep 12. Invest Ophthalmol Vis Sci. 2009. PMID: 18791173 Free PMC article. - Cholinergic changes in the APP23 transgenic mouse model of cerebral amyloidosis.
Boncristiano S, Calhoun ME, Kelly PH, Pfeifer M, Bondolfi L, Stalder M, Phinney AL, Abramowski D, Sturchler-Pierrat C, Enz A, Sommer B, Staufenbiel M, Jucker M. Boncristiano S, et al. J Neurosci. 2002 Apr 15;22(8):3234-43. doi: 10.1523/JNEUROSCI.22-08-03234.2002. J Neurosci. 2002. PMID: 11943824 Free PMC article. - The cholinergic system in aging and neuronal degeneration.
Schliebs R, Arendt T. Schliebs R, et al. Behav Brain Res. 2011 Aug 10;221(2):555-63. doi: 10.1016/j.bbr.2010.11.058. Epub 2010 Dec 9. Behav Brain Res. 2011. PMID: 21145918 Review. - Galanin plasticity in the cholinergic basal forebrain in Alzheimer's disease and transgenic mice.
Mufson EJ, Counts SE, Perez SE, Binder L. Mufson EJ, et al. Neuropeptides. 2005 Jun;39(3):233-7. doi: 10.1016/j.npep.2004.12.005. Epub 2005 Feb 1. Neuropeptides. 2005. PMID: 15893372 Review.
Cited by
- A pilot study on searching for peri-nuclear NeuN-positive cells.
Yu Y, Wu M, Zhang N, Yin H, Shu B, Duan W. Yu Y, et al. PeerJ. 2020 Jan 7;8:e8254. doi: 10.7717/peerj.8254. eCollection 2020. PeerJ. 2020. PMID: 31938576 Free PMC article. - Empagliflozin reduces vascular damage and cognitive impairment in a mixed murine model of Alzheimer's disease and type 2 diabetes.
Hierro-Bujalance C, Infante-Garcia C, Del Marco A, Herrera M, Carranza-Naval MJ, Suarez J, Alves-Martinez P, Lubian-Lopez S, Garcia-Alloza M. Hierro-Bujalance C, et al. Alzheimers Res Ther. 2020 Apr 7;12(1):40. doi: 10.1186/s13195-020-00607-4. Alzheimers Res Ther. 2020. PMID: 32264944 Free PMC article. - Neuroprotective role for galanin in Alzheimer's disease.
Counts SE, Perez SE, Ginsberg SD, Mufson EJ. Counts SE, et al. Exp Suppl. 2010;102:143-62. doi: 10.1007/978-3-0346-0228-0_11. Exp Suppl. 2010. PMID: 21299067 Free PMC article. Review. - Sleep and EEG Power Spectral Analysis in Three Transgenic Mouse Models of Alzheimer's Disease: APP/PS1, 3xTgAD, and Tg2576.
Kent BA, Strittmatter SM, Nygaard HB. Kent BA, et al. J Alzheimers Dis. 2018;64(4):1325-1336. doi: 10.3233/JAD-180260. J Alzheimers Dis. 2018. PMID: 29991134 Free PMC article. - Small molecule p75NTR ligand prevents cognitive deficits and neurite degeneration in an Alzheimer's mouse model.
Knowles JK, Simmons DA, Nguyen TV, Vander Griend L, Xie Y, Zhang H, Yang T, Pollak J, Chang T, Arancio O, Buckwalter MS, Wyss-Coray T, Massa SM, Longo FM. Knowles JK, et al. Neurobiol Aging. 2013 Aug;34(8):2052-63. doi: 10.1016/j.neurobiolaging.2013.02.015. Epub 2013 Mar 29. Neurobiol Aging. 2013. PMID: 23545424 Free PMC article.
References
- Araujo DM, Lapchak PA, Robitaille Y, Gauthier S, Quirion R. Differential alteration of various cholinergic markers in cortical and subcortical regions of human brain in Alzheimer’s disease. J Neurochem. 1988;50:1914–1923. - PubMed
- Arnold SE, Hyman BT, Flory J, Damasio AR, Van Hoesen GW. The topographical and neuroanatomical distribution of neurofibrillary tangles and neuritic plaques in the cerebral cortex of patients with Alzheimer’s disease. Cereb Cortex. 1991;1:103–116. - PubMed
- Aucoin JS, Jiang P, Aznavour N, Tong XK, Buttini M, Descarries L, Hamel E. Selective cholinergic denervation, independent from oxidative stress, in a mouse model of Alzheimer’s disease. Neuroscience. 2005;132:73–86. - PubMed
- Bayraktar T, Staiger JF, Acsady L, Cozzari C, Freund TF, Zilles K. Colocalization of vasoactive intestinal polypeptide, gamma-aminobutyric acid and choline acetyltransferase in neocortical interneurons of the adult rat. Brain Res. 1997;757:209–217. - PubMed
Publication types
MeSH terms
Substances
Grants and funding
- P01 AG014449/AG/NIA NIH HHS/United States
- R01 AG010668/AG/NIA NIH HHS/United States
- R01 AG010668-14A1/AG/NIA NIH HHS/United States
- R01 AG043375/AG/NIA NIH HHS/United States
LinkOut - more resources
Full Text Sources
Medical
Molecular Biology Databases
Miscellaneous


