The anterior visceral endoderm of the mouse embryo is established from both preimplantation precursor cells and by de novo gene expression after implantation - PubMed (original) (raw)
The anterior visceral endoderm of the mouse embryo is established from both preimplantation precursor cells and by de novo gene expression after implantation
Maria-Elena Torres-Padilla et al. Dev Biol. 2007.
Abstract
Initiation of the development of the anterior-posterior axis in the mouse embryo has been thought to take place only when the anterior visceral endoderm (AVE) emerges and starts its asymmetric migration. However, expression of Lefty1, a marker of the AVE, was recently found to initiate before embryo implantation. This finding has raised two important questions: are the cells that show such early, preimplantation expression of this AVE marker the real precursors of the AVE and, if so, how does this contribute to the establishment of the AVE? Here, we address both of these questions. First, we show that the expression of another AVE marker, Cer1, also commences before implantation and its expression becomes consolidated in the subset of ICM cells that comprise the primitive endoderm. Second, to determine whether the cells showing this early Cer1 expression are true precursors of the AVE, we set up conditions to trace these cells in time-lapse studies from early periimplantation stages until the AVE emerges and becomes asymmetrically displaced. We found that Cer1-expressing cells are asymmetrically located after implantation and, as the embryo grows, they become dispersed into two or three clusters. The expression of Cer1 in the proximal domain is progressively diminished, whilst it is reinforced in the distal-lateral domain. Our time-lapse studies demonstrate that this distal-lateral domain is incorporated into the AVE together with cells in which Cer1 expression begins only after implantation. Thus, the AVE is formed from both part of an ancestral population of Cerl-expressing cells and cells that acquire Cer1 expression later. Finally, we demonstrate that when the AVE shifts asymmetrically to establish the anterior pole, this occurs towards the region where the earlier postimplantation expression of Cer1 was strongest. Together, these results suggest that the orientation of the anterior-posterior axis is already anticipated before AVE migration.
Figures
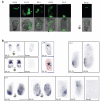
Figure 1. Spatial and temporal pattern of Cer1 expression in periimplantation mouse embryos
A. Embryos derived from a transgenic line where GFP is driven by the Cer1 promoter were collected at the indicated stages and imaged under an inverted fluorescent microscope. Expression of Cer1 is detected in the primitive endoderm from E4.25. Note that between E4.25 and E4.75 one side of the bilaterally symmetrical embryo (white arrows) displays higher intensity of GFP fluorescence. Scale bar 50 μm. In E5.0 and E5.25 embryos, Cer1/GFP expression was restricted to the visceral endoderm. Note in E5.25 embryos, GFP accumulation in a distal-lateral region, laterally around the boundary towards the extraembryonic region and in the proximal most region around the ectoplacental cone. Fluorescent (top) and merge (bottom) micrographies are shown. Shown are representative embryos of at least 10 embryos analysed per stage. B. Endogenous expression of Cer1 recapitulates the pattern of Cer1/GFP expression. Embryos from wild-type crosses were collected at the indicated stages, fixed and processed for in situ hybridisation for Cer1. At E4.25, mRNA for Cer1 is found in the cells lining the blastocoeilic cavity. Later at E4.75, Cer1 is expressed in the primitive endoderm. Note that the staining tends to be stronger on one side of the primitive endoderm (black arrows). At E5.25 expression of Cer1 is variable within different regions of the visceral endoderm. Embryos incubated with the sense probe were stained for the same time as those with the antisense probe and both groups were treated in parallel under the same conditions. As control, we performed in parallel in situ hybridisation for embryos of later stages in all experiments, this shows that Cer1 expression is restricted to the AVE at E5.75 and E6.25. As indicated, embryos at E4.25 (n=5) and at E4.75 (n=6) were processed for in situ hybridization for Lefty1. Scale bar is 100 μm.
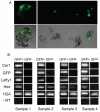
Figure 2. Lefty1 and Cer1 are co-expressed in the late blastocyst, whereas Hex has a broader expression pattern
A. E4.75 Cer1/GFP transgenic embryos were dissociated into single cells and exposure to UV fluorescence was used to identify GFP positive (GFP+) and GFP negative cells (GFP-). Approximately 8 GFP+ and 8 GFP-cells were pooled and processed for RT-PCR per sample per embryo. B. RT-PCR analysis of GFP+ ad GFP-cells from E4.75 dissociated blastocysts. Each sample represents cells dissociated from a single embryo. In all samples, Cer1 and GFP are co-expressed in the same cells, indicating that the transgene faithfully recapitulates endogenous Cer1 expression. Only the cells which express Cer1 also express Lefty1. In contrast, in half of the embryos, Hex is co-expressed in both Cer1 positive and negative cell samples, (Samples 2 and 3), whereas in the remaining, Hex is only expressed in cells positive for Cer1 (Samples 1 and 4). Cells were processed for H2A and –RT for positive and negative controls, respectively.
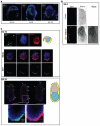
Figure 3. Distribution of CER1 protein in periimplantation and early post-implantation mouse embryos
A. Embryos were collected at E4.25, E4.5 or E4.75, fixed, and processed for immunostaining with the Cer1 antibody (green) and TOTO-3 (DNA, blue). Embryos were analysed under confocal microscopy. Cer1 localises to the cytoplasm of primitive endoderm cells and the protein is clearly enriched towards one side of the embryo (Left on the panel). Note that the polar trophectoderm and the parietal endoderm become very ‘sticky’ as seen with the accumulation of the TOTO-3 dye. Scale bar 50 μm. B. The Cer1 antibody specifically stains the AVE of E6.5 embryos. Embryos at E6.5 were collected and processed as in A for immunostaining for Cer1. In the control panel, embryos were processed with the secondary antibody only. Shown are projections of z-series acquisitions. Embryos oriented with their anterior pole to the left. C. Double immunostaining of E4.75 (top) and E5.25 (bottom) embryos with Cer1 and vHNF1 antibodies. Embryos were processed as in A. For both stages, a diagrammatic representation is shown at the right side of the merge panels. Primitive endoderm / visceral endoderm is shown in yellow, epiblast in blue and polar trophectoderm/extraembryonic ectoderm in grey. For E4.75 embryos, stack projections of z-series images of single channel acquisitions for CER1 (green), DNA (blue) and vHNF1 (red) are shown in the top panel. Merge images of representative single optical sections of this same embryo and the corresponding greyscale image of the green channel (Cer1) are also shown. White arrowheads point to the regions of accumulation of CER1 in the primitive endoderm, where one side with bigger accumulation can be distinguished. For E5.25 embryos, representative single optical merge images of the same embryo are shown at the top. Cer1 is shown in green, DNA in blue and vHNF1 in red. Sites of CER1 accumulation are indicated with white arrowheads. The region within the white square in the middle image is shown under a higher magnification in the bottom of the panel. CER1 is expressed in a subpopulation of visceral endoderm cells. Scale bar is 100 μm.
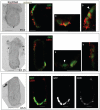
Figure 4. Double immunostaining for GFP and CER1 at early postimplantation stages
Embryos were processed in parallel for immunostaining with an anti-GFP antibody (Green) and an anti-CER1 (red) antibody and analysed under an inverted confocal microscope. Individual optical sections for brightfield and fluorescence scanning are shown. Higher magnifications of the regions depicted by squares on the brightfield image are shown at the right (a and b). In the bottom panel greyscale images of the green (GFP) and red (CER1) channels are shown. Approximate stages are indicated, note the distinctive morphological features for these: at the earliest stage analysed the extraembryonic ectoderm has not yet expanded (top); in the E5.25 embryo the proamniotic cavity has not formed yet (middle), in contrast to the E5.5 embryo where AVE cells have started their migration (bottom). Note that the GFP localises to both nucleus and cytoplasmic whereas CER1 is exclusively cytoplasmic. All cells positive for GFP were also positive for CER1, however, some cells that were positive for GFP displayed very low levels of CER1 accumulation (arrowheads). We quantified the number of cells which exhibit these discrepancies and found that they were minimal (less than 1% of the cells showed either CER1 or GFP staining only throughout all the stages/embryos analysed) and therefore this would not have a major impact in our analyses. Scale bar is 30 μm. Note that the whole mount images are of the middle plane of the embryo, however, in the magnified images, the plane with the best resolution is presented.
Figure 5. Expression of Cer1 is independent of interactions with the uterus as it arises in the primitive endoderm after in vitro culture of blastocysts
E3.5 blastocysts from F1X_Cer1_/GFP crosses were flushed from the uterus and cultured under the microscope. Cer1/GFP expression is first detected after 32h of culture (white arrows). It is observed in the superficial ICM cells throughout the movie. The fluorescent images are only one of six z-planes, hence not all positive cells within an embryo are shown. Note also that the levels of expression, as seen from fluorescence intensity, can vary in different cells within the same and/or different embryos. Scale bar 50 μm.
Figure 6. The population of Cer1 expressing cells at E5.25 is constituted mainly by cells that express Cer1 at E4.75
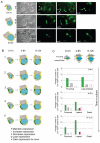
A. Representative time lapse imaging of an E4.75 embryo cultured until approximately E5.25. Embryos were recovered at E4.75 and cultured for 16 h under time-lapse microscopy. Images were collected at 6 different Z-planes along approximately 70 to 75 μm covering the diameter of the embryo at each time point and images were collected every 20 minutes. Images captured at time zero, after 6.5 and 16 (endpoint) h of culture are shown. A diagram showing the stage and orientation of the embryo is shown on the left side of the brightfield image. To illustrate how we identified the Cer1/GFP positive cells, different Z-planes of the green channel are shown (indicated by a z) on the right side of the corresponding brightfield image for each time point. This enabled us to ensure no cells were masked by/masking other positive cells and as such for one Z-plane, not all of the positive cells will be visible. For example, 7 Cer1/GFP positive cells can be identified through the Z-planes at E4.75 (depicted by white arrowheads). The different tissues of the embryo are indicated. PTe, polar trophectoderm; VE, visceral endoderm; EPI, epiblast; ECO, ectoplacental cone. Scale bar is 100 μm B. Schematic examples of 5 of the embryos analysed with time-lapse microscopy. Three different time-points: start, middle and end, corresponding approximately to E4.75, E5.0 and E5.25, respectively are illustrated. The position and destiny of cells (circles) which express Cer1/GFP at E4.75 are indicated with a colour code: in green, the cells that maintain expression of Cer1/GFP (a cell was considered to maintain the expression when either it and/or its progeny were GFP positive at the endpoint); in white, a cell that loses Cer1/GFP expression; and in pink a cell that acquires de novo expression during culture. Note that all embryos have a distal or lateral-distal patch by E5.25. C. Histograms illustrating both distribution and behaviour of Cer1/GFP expressing cells from E4.75. Positioning of cells was scored according to region within the embryo as shown in the diagram. Time in culture and behaviour of the expressing cells is indicated. Data is indicated as the average number of Cer1/GFP positive cells per embryo (n=14 embryos).
Figure 7. Time-lapse studies from E5.0 indicate that the AVE is composed of ‘precursor’ cells originally expressing Cer1/GFP and cells that are induced to express Cer1/GFP
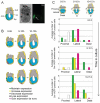
A. Representative embryo showing the stage at the end of culture from E5.0, where the clear asymmetric domain of the AVE is evident (arrowed). Brightfield and fluorescent images are shown. B. Schematic images of Cer1/GFP expression in embryos cultured from E5.0. Dots represent localisation of and behaviour of expressing cells as indicated by the colour code below the diagrams. Three time frames during culture indicated. C. Histograms illustrating both distribution and behaviour of Cer1/GFP expressing cells from E5.0. Positioning of cells was scored according to region within the embryo as shown in the diagram (Proximal: 2 cell lengths above and below the embryonic/extraembryonic boundary; Lateral: 1/3 total length of the egg cylinder below and distal to the proximal region, and Distal: the distal most cell according to the proximal-distal axis and 2 adjacent cells). Time in culture and behaviour of expressing cells is indicated. Data is indicated as the average number of Cer1/GFP positive cells per embryo for 9 embryos (for 0-5h and 5-10h) and 8 embryos for 10-15h.
Figure 8. The AVE is composed of cells originally expressing Cer1 at early stages as well as of cells acquiring expression around E5.5
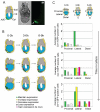
A. Representative embryo showing the stage reached at the end of the culture from E5.25. Due to the high sensitivity acquisition conditions used, our time-lapse analysis was stopped at this point when the fluorescence intensity reached a level where we were no longer able to resolve single cells. Arrow points to the AVE. Brightfield and fluorescence images are shown. B. Schematic images of Cer1/GFP expression in embryos cultured from E5.25. Dots represent localisation and behaviour of expressing cells as indicated by the colour code below the diagrams. Three time frames during culture indicated. C. Histograms illustrating both distribution and behaviour of Cer1/GFP expressing cells from E5.25. Positioning of cells was scored according to region within the embryo as shown in the diagram (Proximal: 2 cell lengths above and below the embryonic/extraembryonic boundary; Lateral: 1/3 total length of the egg cylinder below the distal to the proximal region, and Distal: the distal most cell according to the proximal-distal axis and 2 adjacent cells). Time in culture and behaviour of the expressing cells is indicated. Data is indicated as the average number of Cer1/GFP positive cells per embryo for 11 embryos (for 0-3h and 3-6h) and 9 embryos for 6-9h.
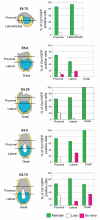
Figure 9. Summary of the contribution of ‘old’ and ‘new’ population of _Cer1_expressing cells to the AVE from E4.75
Cer1/GFP positive cells that maintain (includes cells increasing, decreasing, dividing) Cer1/GFP expression are plotted versus the ones that lose Cer1/GFP expression. VE cells acquiring Cer1/GFP expression are also shown. It can be seen that during the formation of the AVE between E5.5 and E5.75, Cer1 expression is induced in the lateral and distal regions of the embryo but that also ‘precursors’ cells (in green) maintain Cer1 expression. Data is expressed as the percentage of the total number of Cer1/GFP positive cells in all embryos per region of the embryo and is derived from data presented in Figures 5,6,7.
Similar articles
- AVE protein expression and visceral endoderm cell behavior during anterior-posterior axis formation in mouse embryos: Asymmetry in OTX2 and DKK1 expression.
Hoshino H, Shioi G, Aizawa S. Hoshino H, et al. Dev Biol. 2015 Jun 15;402(2):175-91. doi: 10.1016/j.ydbio.2015.03.023. Epub 2015 Apr 22. Dev Biol. 2015. PMID: 25910836 - Origin and role of distal visceral endoderm, a group of cells that determines anterior-posterior polarity of the mouse embryo.
Takaoka K, Yamamoto M, Hamada H. Takaoka K, et al. Nat Cell Biol. 2011 May 29;13(7):743-52. doi: 10.1038/ncb2251. Nat Cell Biol. 2011. PMID: 21623358 - Regionalised signalling within the extraembryonic ectoderm regulates anterior visceral endoderm positioning in the mouse embryo.
Richardson L, Torres-Padilla ME, Zernicka-Goetz M. Richardson L, et al. Mech Dev. 2006 Apr;123(4):288-96. doi: 10.1016/j.mod.2006.01.004. Epub 2006 Mar 3. Mech Dev. 2006. PMID: 16517131 - Heading forwards: anterior visceral endoderm migration in patterning the mouse embryo.
Stower MJ, Srinivas S. Stower MJ, et al. Philos Trans R Soc Lond B Biol Sci. 2014 Dec 5;369(1657):20130546. doi: 10.1098/rstb.2013.0546. Philos Trans R Soc Lond B Biol Sci. 2014. PMID: 25349454 Free PMC article. Review. - The anterior visceral endoderm-turning heads.
Srinivas S. Srinivas S. Genesis. 2006 Nov;44(11):565-72. doi: 10.1002/dvg.20249. Genesis. 2006. PMID: 17078044 Review.
Cited by
- Using high throughput screens to predict miscarriages with placental stem cells and long-term stress effects with embryonic stem cells.
Puscheck EE, Ruden X, Singh A, Abdulhasan M, Ruden DM, Awonuga AO, Rappolee DA. Puscheck EE, et al. Birth Defects Res. 2022 Oct 1;114(16):1014-1036. doi: 10.1002/bdr2.2079. Epub 2022 Aug 18. Birth Defects Res. 2022. PMID: 35979652 Free PMC article. Review. - Activin/Nodal signalling before implantation: setting the stage for embryo patterning.
Papanayotou C, Collignon J. Papanayotou C, et al. Philos Trans R Soc Lond B Biol Sci. 2014 Dec 5;369(1657):20130539. doi: 10.1098/rstb.2013.0539. Philos Trans R Soc Lond B Biol Sci. 2014. PMID: 25349448 Free PMC article. Review. - Discovering a sparse set of pairwise discriminating features in high-dimensional data.
Melton S, Ramanathan S. Melton S, et al. Bioinformatics. 2021 Apr 19;37(2):202-212. doi: 10.1093/bioinformatics/btaa690. Bioinformatics. 2021. PMID: 32730566 Free PMC article.
References
- Barbacci E, Reber M, Ott MO, Breillat C, Huetz F, Cereghini S. Variant hepatocyte nuclear factor 1 is required for visceral endoderm specification. Development. 1999;126:4795–805. - PubMed
- Brennan J, Lu CC, Norris DP, Rodriguez TA, Beddington RS, Robertson EJ. Nodal signalling in the epiblast patterns the early mouse embryo. Nature. 2001;411:965–9. - PubMed
- Chazaud C, Rossant J. Disruption of early proximodistal patterning and AVE formation in APC mutants. Development. 2006;133:3379–3387. - PubMed
- Coffinier C, Thepot D, Babinet C, Yaniv M, Barra J. Essential role for the homeoprotein vHNF1/HNF1beta in visceral endoderm differentiation. Development. 1999;126:4785–94. - PubMed
Publication types
MeSH terms
Substances
LinkOut - more resources
Full Text Sources
Other Literature Sources
Molecular Biology Databases
