BAFF and MyD88 signals promote a lupuslike disease independent of T cells - PubMed (original) (raw)
BAFF and MyD88 signals promote a lupuslike disease independent of T cells
Joanna R Groom et al. J Exp Med. 2007.
Abstract
Systemic lupus erythematosus (SLE) is a systemic autoimmune disease characterized by the production of autoantibodies. However, the underlying cause of disease appears to relate to defects in T cell tolerance or T cell help to B cells. Transgenic (Tg) mice overexpressing the cytokine B cell-activating factor of the tumor necrosis factor family (BAFF) develop an autoimmune disorder similar to SLE and show impaired B cell tolerance and altered T cell differentiation. We generated BAFF Tg mice that were completely deficient in T cells, and, surprisingly, these mice developed an SLE-like disease indistinguishable from that of BAFF Tg mice. Autoimmunity in BAFF Tg mice did, however, require B cell-intrinsic signals through the Toll-like receptor (TLR)-associated signaling adaptor MyD88, which controlled the production of proinflammatory autoantibody isotypes. TLR7/9 activation strongly up-regulated expression of transmembrane activator and calcium modulator and cyclophilin ligand interactor (TACI), which is a receptor for BAFF involved in B cell responses to T cell-independent antigens. Moreover, BAFF enhanced TLR7/9 expression on B cells and TLR-mediated production of autoantibodies. Therefore, autoimmunity in BAFF Tg mice results from altered B cell tolerance, but requires TLR signaling and is independent of T cell help. It is possible that SLE patients with elevated levels of BAFF show a similar basis for disease.
Figures
Figure 1.
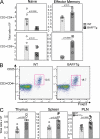
T cell abnormalities in BAFF Tg mice. T cell subsets were determined by FACS, as described in the Materials and methods. (A) Total splenic T cell numbers of CD4+ (top) and CD8+ (bottom). Naive (left) or effector–memory (right) T cells were assessed from 12-mo-old WT (circle) and BAFF Tg (square) mice. (B) Representative FACS plots of PLN FoxP3+ T reg cells from WT (left) and BAFF Tg (right) mice. The T reg cell population is indicated with a box. (C) Total numbers of T reg cells from WT (circle) and BAFF Tg (square) mice from thymus, spleen, and PLN. In A and C, symbols represent individual mice, and the mean for each group is indicated by a column. Significant P values are shown. n ≥ 7 per group.
Figure 2.
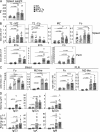
Similar splenomegaly, B cell hyperplasia, and elevated Ig levels in TΔ-BTg and Baff Tg mice. 12-mo-old WT (circle), TCR−/− (diamond), BAFF Tg (square), and TΔ-BTg (triangle) mice were assessed for spleen size (A) and total numbers of T2-MZ, T2-Fo, MZ, and Fo B cell subsets in spleen and B1a, B1b, and Fo B cells in peritoneal lavage (PerC; B). (C) Fo and MZ B cells in peripheral blood (left) and PLN (right). Subsets were gated by FACS analysis as described in Materials and methods. (D) Basal Ig levels in TΔ-BTg mice and control mice. Symbols represent individual mice, and columns indicate the mean for each group. Significant P values are shown. n ≥ 7 per group.
Figure 3.
Increased switching to T cell–independent antigens and low-level switching to T cell–dependent antigens in TΔ-BTg mice. Titers of antigen-specific Ig from 12-wk-old WT (circle), TCR−/− (diamond), BAFF Tg (square), and TΔ-BTg (triangle) mice were determined, 5 d after T cell–independent NP-Ficoll immunization (A) and 28 d after initial T cell–dependent immunization NP-OVA (B). Symbols represent individual mice, and the mean for each group is indicated by a column. n ≥ 5 per group. Significant P values are shown between TΔ-BTg v BAFF Tg and TΔ-BTg v TCR−/− groups.
Figure 4.
Production of IgM and IgG, but not IgA, autoantibodies in TΔ-BTg mice. (A) ELISA was used to determine IgG, IgA, and IgM anti-ssDNA (top), anti-dsDNA (middle), and RF (bottom) in serum from 8-mo-old WT (circle), TCR−/− (diamond), BAFF Tg (square), and TΔ-BTg (triangle) mice. Symbols represent individual mice, and the mean for each group is indicated by columns. Significant P values are shown. n ≥ 6 per group. (B) Representative staining of isotype-specific ANA and anti-dsDNA were determined by staining Hep-2 and C. luciliae slides, respectively, with serum from indicated mice.
Figure 5.
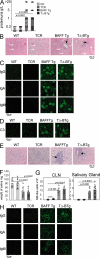
TΔ-BTg and BAFF Tg mice develop indistinguishable kidney and salivary gland pathology. In A, F, and G, the mice are WT (circle), TCR−/− (diamond), BAFF Tg (square), and TΔ-BTg (triangle). Symbols represent individual mice, and the mean for each group is indicated by a column. (A) Proteinuria analysis of 12-mo-old animals. (B) HE staining of kidney tissue sections. BAFF Tg and TΔ-BTg sections show glomeruli separation (white arrows) and mononuclear cell infiltrate (black arrows). (C) IgG, IgA, and IgM (D) C3 deposition in the kidney of 8-mo-old mice. (E) HE staining of salivary gland tissue sections from BAFF Tg and TΔ-BTg sections show salivary gland destruction and lymphocyte infiltrate (black arrows). (F) Saliva flow after pilocarpine injection in 8-mo-old animals. (G) Total numbers of MZ-like B cells detected in CLN and salivary glands. (H) Isotype-specific Ig deposition in salivary gland of 8-mo-old mice. Significant P values are shown.
Figure 6.
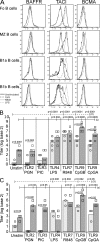
TLR7/9, but not TLR7, ligands increase BAFF-R expression, and BAFF enhances TLR-mediated autoantibody secretion. (A) FACS-sorted Fo, MZ, B1a, and B1b B cells were stimulated with the following: unstimulated (solid black), CpG (TLR9; dashed black), R848 (TLR7; solid gray), and LPS (TLR4; dashed gray) for 24 h and analyzed for surface expression of BAFF-Rs by FACS, as indicated. Histograms are representative of three individual sorting and culture experiments. MZ (B) and B1 (C) BAFF Tg B cells were cultured with TLR ligands with (squares) or without (circles) BAFF for 6 d. Total anti-dsDNA antibody levels in culture supernatants were measured by ELISA. Symbols indicate individual cultures. In C and D, significant P values are shown between TLR-stimulated cultures with or without BAFF, between unstimulated and TLR stimulated (dashed line [x]) and between unstimulated with BAFF and TLR-stimulated with BAFF (solid line [y]).
Figure 7.
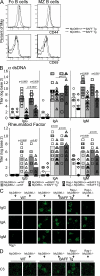
MyD88 signaling is essential for B cell activation and IgG autoantibody production in BAFF Tg mice. Lethally irradiated 6-wk-old BAFF Tg mice were reconstituted with MyD88+/+ or MyD88−/− or mixed Rag1−/−MyD88+/+ or Rag1−/−MyD88−/− BM, as indicated. (A) Histogram of B cell activation markers CD44 (top) and CD69 (bottom) of Fo (left) and MZ (right) splenic B cells from MyD88+/+ (solid line) and MyD88−/− (dashed line) BAFF Tg BM chimeras. (B) Anti-dsDNA and RF antibody production in WT mice reconstituted with MyD88+/+ (circles) or MyD88−/− (diamonds); BAFF Tg mice reconstituted with MyD88+/+ (squares; light gray bar); or MyD88−/− (triangles; light gray bar); or BAFF Tg mice reconstituted with Rag1−/−MyD88+/+ (squares; dark gray bar); or Rag1−/−MyD88−/− (triangles; dark gray bar). IgG, IgA, and IgM (C) and C3 (D) deposition in the kidney of BAFF Tg mice reconstituted with MyD88+/+, MyD88−/−, Rag1−/−MyD88+/+, or Rag1−/−MyD88−/− BM, as indicated. Significant P values are shown.
Figure 8.
Model of BAFF-induced, T cell–independent autoimmune disease. (Stage 1) Excess levels of BAFF expand self-reactive MZ and B1 B cells (24). (Stage 2) BAFF signals promote TLR activation after internalization of autoreactive B cell receptors bound to either dsDNA or to immune complexes containing nucleic acids. (Stage 3) Positive feedback of this activation exists, with BAFF increasing TLR7/9 expression and TLR7/9 ligands stimulating BAFF-R expression. (Stage 4) BAFF enhances TLR signals, which lead to the production of IgG2c and IgG2b antibodies. Autoantibodies deposit in the kidney and promote inflammation through complement fixation.
Similar articles
- Deleting the BAFF receptor TACI protects against systemic lupus erythematosus without extensive reduction of B cell numbers.
Figgett WA, Deliyanti D, Fairfax KA, Quah PS, Wilkinson-Berka JL, Mackay F. Figgett WA, et al. J Autoimmun. 2015 Jul;61:9-16. doi: 10.1016/j.jaut.2015.04.007. Epub 2015 May 29. J Autoimmun. 2015. PMID: 26027434 - Integrated B Cell, Toll-like, and BAFF Receptor Signals Promote Autoantibody Production by Transitional B Cells.
Du SW, Jacobs HM, Arkatkar T, Rawlings DJ, Jackson SW. Du SW, et al. J Immunol. 2018 Dec 1;201(11):3258-3268. doi: 10.4049/jimmunol.1800393. Epub 2018 Oct 29. J Immunol. 2018. PMID: 30373855 Free PMC article. - BAFF-driven autoimmunity requires CD19 expression.
Fairfax KA, Tsantikos E, Figgett WA, Vincent FB, Quah PS, LePage M, Hibbs ML, Mackay F. Fairfax KA, et al. J Autoimmun. 2015 Aug;62:1-10. doi: 10.1016/j.jaut.2015.06.001. Epub 2015 Jun 20. J Autoimmun. 2015. PMID: 26103922 - The BAFF/APRIL system: emerging functions beyond B cell biology and autoimmunity.
Vincent FB, Saulep-Easton D, Figgett WA, Fairfax KA, Mackay F. Vincent FB, et al. Cytokine Growth Factor Rev. 2013 Jun;24(3):203-15. doi: 10.1016/j.cytogfr.2013.04.003. Epub 2013 May 15. Cytokine Growth Factor Rev. 2013. PMID: 23684423 Free PMC article. Review. - B cells flying solo.
Groom J, Mackay F. Groom J, et al. Immunol Cell Biol. 2008 Jan;86(1):40-6. doi: 10.1038/sj.icb.7100142. Immunol Cell Biol. 2008. PMID: 18172443 Review.
Cited by
- Lymphocytes Change Their Phenotype and Function in Systemic Lupus Erythematosus and Lupus Nephritis.
Moysidou E, Christodoulou M, Lioulios G, Stai S, Karamitsos T, Dimitroulas T, Fylaktou A, Stangou M. Moysidou E, et al. Int J Mol Sci. 2024 Oct 10;25(20):10905. doi: 10.3390/ijms252010905. Int J Mol Sci. 2024. PMID: 39456692 Free PMC article. Review. - Potential of resveratrol in the treatment of systemic lupus erythematosus (Review).
Huo R, Yang Y, Huo X, Meng D, Huang R, Yang Y, Lin J, Huang Y, Zhu X, Wei C, Huang X. Huo R, et al. Mol Med Rep. 2024 Oct;30(4):182. doi: 10.3892/mmr.2024.13306. Epub 2024 Aug 19. Mol Med Rep. 2024. PMID: 39155862 Free PMC article. Review. - Autoimmune diseases and atherosclerotic cardiovascular disease.
Porsch F, Binder CJ. Porsch F, et al. Nat Rev Cardiol. 2024 Nov;21(11):780-807. doi: 10.1038/s41569-024-01045-7. Epub 2024 Jun 27. Nat Rev Cardiol. 2024. PMID: 38937626 Review. - Germinal center versus extrafollicular responses in systemic autoimmunity: Who turns the blade on self?
He Y, Vinuesa CG. He Y, et al. Adv Immunol. 2024;162:109-133. doi: 10.1016/bs.ai.2024.02.002. Epub 2024 Mar 6. Adv Immunol. 2024. PMID: 38866437 Free PMC article. Review. - Inflammatory CD11b+ Macrophages Produce BAFF in Spleen of Mice Infected with Leishmania donovani.
Nagai K, Fujii W, Yamagishi J, Sanjoba C, Goto Y. Nagai K, et al. Pathogens. 2024 Mar 6;13(3):232. doi: 10.3390/pathogens13030232. Pathogens. 2024. PMID: 38535575 Free PMC article.
References
- Mills, J.A. 1994. Systemic Lupus Erythematosus. N. Engl. J. Med. 330:1871–1879. - PubMed
- Kang, I., and J. Craft. 2006. Systemic lupus erythematosus: immunological features. In The Autoimmune Diseases. Fourth edition. N.R. Rose and I.R. Mackay, editors. Elsevier Academic Press Publication. 357–368 pp
- Davidson, A., and C. Aranow. 2006. Pathogenesis and treatment of systemic lupus erythematosus nephritis. Curr. Opin. Rheumatol. 18:468–475. - PubMed
- Isenberg, D., and A. Rahman. 2005. Systemic lupus erythematosus-2005 annus mirabillis. Nat. Clin. Pract. Rheumatol. 2:145–152. - PubMed
- Mackay, F., P. Schneider, P. Rennert, and J.L. Browning. 2003. BAFF and APRIL: a tutorial on B cell survival. Annu. Rev. Immunol. 21:231–264. - PubMed
Publication types
MeSH terms
Substances
LinkOut - more resources
Full Text Sources
Other Literature Sources
Molecular Biology Databases
Miscellaneous
