The molecular basis of eukaryotic transcription - PubMed (original) (raw)
Review
The molecular basis of eukaryotic transcription
Roger D Kornberg. Proc Natl Acad Sci U S A. 2007.
No abstract available
Figures
Fig. 1.
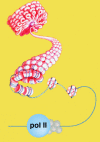
The nucleosome, the fundamental particle of the eukaryote chromosome. Schematic shows the coiling of DNA around a set of eight histones in the nucleosome, the further coiling in condensed (transcriptionally inactive) chromatin, and uncoiling for interaction with the RNA polymerase II (pol II) transcription machinery.
Fig. 2.
Mediator of transcriptional regulation. Schematic shows the transduction of regulatory information from a gene activator protein bound to an enhancer DNA element to the pol II transcription machinery at a promoter.
Fig. 3.
The RNA polymerase II transcription machinery. Masses are round figures for proteins from the yeast Saccharomyces cerevisiae.
Fig. 4.
Two-dimensional protein crystallization on lipid layers. Schematic shows the binding of a protein of interest (oval objects) to the head groups (red triangles) of lipid molecules in a monolayer at the air–water interface. Rapid lateral diffusion of the lipids leads to protein crystallization.
Fig. 5.
Structure of RNA polymerase II at 2.8-Å resolution. The protein is shown in ribbon representation, with a color code to the various subunits and interaction diagram at the upper right. A Mg ion at the active center is depicted as a pink sphere.
Fig. 6.
Structure of RNA polymerase II in the act of gene transcription at near atomic resolution. The polypeptide chain is shown in white, orange (mobile “clamp”), and green (bridge helix connecting the two largest subunits). Backbone models of the nucleic acids are shown in blue (template DNA strand), green (nontemplate DNA strand), and red (RNA).
Fig. 7.
A cycle of nucleotide addition by RNA polymerase II. At the upper left, the structure from Fig. 6 is shown, omitting all but the DNA and RNA near the active center and the bridge helix. The ribonucleotide in the active center, just added to the RNA chain, is yellow. At the lower left is the structure after translocation of DNA and RNA across the pol II surface. At the lower right is the structure with an unmatched NTP in the entry (E) site. At the upper right is the structure with NTP, matched for pairing to the coding base in the template strand, in the addition (A) site.
Fig. 8.
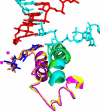
The trigger loop. Transcribing complex structures with purine nucleotide (orange) or pyrimidine nucleotide (dark blue) in the addition site (compare that in the upper right panel of Fig. 7) are shown superimposed. The corresponding trigger loops are purple and yellow, and the bridge helices are green and light blue.
Fig. 9.
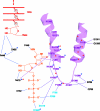
The trigger loop network. Trigger loop is magenta, GTP is orange, and the 3′ end of the RNA is red. Other residues of Rpb1 and Rpb2 are indicated in black and cyan. Stars identify residues whose mutation impairs transcript elongation in vivo (blue from the literature, red from an unpublished screen by Craig Kaplan).
Fig. 10.
The trigger loop couples NTP recognition to phosphodiester bond formation. Color scheme is the same as in Fig. 8, with side chains of Rpb2 Arg-1020 and Rpb2 Arg-766 in yellow. Contacts responsible for alignment and the contact of histidine 1085 with the NTP that promotes catalysis are indicated by dashed yellow lines. Nucleophilic attack and phosphoanhydride bond breakage are indicated by black arrows.
Fig. 11.
Straight and bent states of the bridge helix in RNA polymerase II and bacterial RNA polymerase structures, proposed to underlie nucleic acid translocation during transcription. Color code is the same as in Fig. 6 except with bridge helix in purple.
Fig. 12.
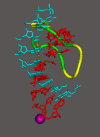
Release of RNA transcript from DNA–RNA hybrid revealed in the structure of an RNA polymerase II transcribing complex. The upstream end of the DNA–RNA hybrid helix, 7–10 residues from the active center, is shown on the left, with distances between the DNA and RNA bases indicated. The entire DNA–RNA hybrid helix is shown on the right, along with protein loops involved in helix melting (rudder and lid) and stabilization (fork loop).
Fig. 13.
Structure of an RNA polymerase II–TFIIB complex. A surface representation of pol II is shown, with the clamp and wall as in Fig. 6, a polypeptide chain trace of the amino terminal region of TFIIB, designated IIBN, in yellow, and the region of the pol II surface interacting with IIBN in green.
Fig. 14.
Superposition of the DNA-hybrid helix from an RNA polymerase II transcribing complex (Fig. 6) and the B finger from an RNA polymerase II–TFIIB complex (Fig. 13). Conserved region of the B finger is green.
Fig. 15.
Model of an RNA polymerase II–TBP–TFIIB–DNA complex. The structure of the C-terminal region of TFIIB (pink) complexed with TBP (green) and TATA-box containing DNA (red/white/blue atomic model) was docked to the structure of the pol II–TFIIB complex (as shown in Fig. 13). The views shown at the left and right are related by a 90° rotation about an axis between them, as indicated by the curved arrow. The direction of view at right is the same as that in Fig. 13.
Fig. 16.
Structure of an RNA polymerase II transcribing complex with the central subunit of TFIIF (work in progress of Guillermo Calero). Pol II and the nucleic acids only are shown on the left, while the structure including the TFIIF subunit (known as Tfg2, in yellow) is shown on the right. Direction of view and color scheme as in Fig. 6.
Fig. 17.
Model of an RNA polymerase II preinitiation complex. Structures shown at the upper left were assembled in the complex shown at the lower right. Direction of view as in Figs. 5 and 13. “4/7” indicates pol II subunits Rpb4 and Rpb7, which were omitted from the original structure (Fig. 5).
Fig. 18.
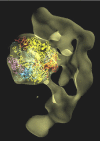
Cryo-EM structure of an RNA polymerase II–Mediator complex. The pol II structure was docked in the central density, and is shown in a similar direction of view and color scheme as Fig. 5.
Similar articles
- [Function and structural biology of general transcription factors and RNA polymerase II in eukaryotes].
Ohkuma Y. Ohkuma Y. Tanpakushitsu Kakusan Koso. 1999 Mar;44(4 Suppl):438-56. Tanpakushitsu Kakusan Koso. 1999. PMID: 10203998 Review. Japanese. No abstract available. - The eukaryotic gene transcription machinery.
Kornberg RD. Kornberg RD. Biol Chem. 2001 Aug;382(8):1103-7. doi: 10.1515/BC.2001.140. Biol Chem. 2001. PMID: 11592390 - Conservation between the RNA polymerase I, II, and III transcription initiation machineries.
Vannini A, Cramer P. Vannini A, et al. Mol Cell. 2012 Feb 24;45(4):439-46. doi: 10.1016/j.molcel.2012.01.023. Mol Cell. 2012. PMID: 22365827 Review. - Structural basis of transcription: an RNA polymerase II-TFIIB cocrystal at 4.5 Angstroms.
Bushnell DA, Westover KD, Davis RE, Kornberg RD. Bushnell DA, et al. Science. 2004 Feb 13;303(5660):983-8. doi: 10.1126/science.1090838. Science. 2004. PMID: 14963322 - RNA polymerase II structure, and organization of the preinitiation complex.
Asturias FJ. Asturias FJ. Curr Opin Struct Biol. 2004 Apr;14(2):121-9. doi: 10.1016/j.sbi.2004.03.007. Curr Opin Struct Biol. 2004. PMID: 15093825 Review.
Cited by
- Oct-1 cooperates with the TATA binding initiation complex to control rapid transcription of human iNOS.
Reveneau S, Petrakis TG, Goldring CE, Chantôme A, Jeannin JF, Pance A. Reveneau S, et al. Cell Mol Life Sci. 2012 Aug;69(15):2609-19. doi: 10.1007/s00018-012-0939-z. Epub 2012 Feb 19. Cell Mol Life Sci. 2012. PMID: 22349263 Free PMC article. - Regulation of mammalian transcription by Gdown1 through a novel steric crosstalk revealed by cryo-EM.
Wu YM, Chang JW, Wang CH, Lin YC, Wu PL, Huang SH, Chang CC, Hu X, Gnatt A, Chang WH. Wu YM, et al. EMBO J. 2012 Aug 29;31(17):3575-87. doi: 10.1038/emboj.2012.205. Epub 2012 Jul 31. EMBO J. 2012. PMID: 22850672 Free PMC article. - Investigation of dmyc Promoter and Regulatory Regions.
Kharazmi J, Moshfegh C. Kharazmi J, et al. Gene Regul Syst Bio. 2013 May 15;7:85-102. doi: 10.4137/GRSB.S10751. Print 2013. Gene Regul Syst Bio. 2013. PMID: 23761963 Free PMC article. - Control of endothelin-a receptor expression by progesterone is enhanced by synergy with Gata2.
Zhang Y, Knutsen GR, Brown MD, Ruest LB. Zhang Y, et al. Mol Endocrinol. 2013 Jun;27(6):892-908. doi: 10.1210/me.2012-1334. Epub 2013 Apr 16. Mol Endocrinol. 2013. PMID: 23592430 Free PMC article. - Coactivators in PPAR-Regulated Gene Expression.
Viswakarma N, Jia Y, Bai L, Vluggens A, Borensztajn J, Xu J, Reddy JK. Viswakarma N, et al. PPAR Res. 2010;2010:250126. doi: 10.1155/2010/250126. Epub 2010 Aug 5. PPAR Res. 2010. PMID: 20814439 Free PMC article.
References
- Kornberg RD. Science. 1974;184:868–871. - PubMed
- Lorch Y, LaPointe JW, Kornberg RD. Cell. 1987;49:203–210. - PubMed
- Han M, Grunstein M. Cell. 1988;55:1137–1145. - PubMed
- Boeger H, Griesenbeck J, Strattan JS, Kornberg RD. Mol Cell. 2003;11:1587–1598. - PubMed
- Matsui T, Segall J, Weil PA, Roeder RG. J Biol Chem. 1980;255:11992–11996. - PubMed
Publication types
MeSH terms
Substances
LinkOut - more resources
Full Text Sources
Other Literature Sources
