Dominant-negative DISC1 transgenic mice display schizophrenia-associated phenotypes detected by measures translatable to humans - PubMed (original) (raw)
. 2007 Sep 4;104(36):14501-6.
doi: 10.1073/pnas.0704774104. Epub 2007 Aug 3.
Hanna Jaaro-Peled, Saurav Seshadri, Kenichi Oishi, Caroline Hookway, Stephanie Kong, Di Wu, Rong Xue, Manuella Andradé, Stephanie Tankou, Susumu Mori, Michela Gallagher, Koko Ishizuka, Mikhail Pletnikov, Satoshi Kida, Akira Sawa
Affiliations
- PMID: 17675407
- PMCID: PMC1964873
- DOI: 10.1073/pnas.0704774104
Dominant-negative DISC1 transgenic mice display schizophrenia-associated phenotypes detected by measures translatable to humans
Takatoshi Hikida et al. Proc Natl Acad Sci U S A. 2007.
Abstract
Here, we report generation and characterization of Disrupted-In-Schizophrenia-1 (DISC1) genetically engineered mice as a potential model for major mental illnesses, such as schizophrenia. DISC1 is a promising genetic risk factor for major mental illnesses. In this transgenic model, a dominant-negative form of DISC1 (DN-DISC1) is expressed under the alphaCaMKII promoter. In vivo MRI of the DN-DISC1 mice detected enlarged lateral ventricles particularly on the left side, suggesting a link to the asymmetrical change in anatomy found in brains of patients with schizophrenia. Furthermore, selective reduction in the immunoreactivity of parvalbumin in the cortex, a marker for an interneuron deficit that may underlie cortical asynchrony, is observed in the DN-DISC1 mice. These results suggest that these transgenic mice may be used as a model for schizophrenia. DN-DISC1 mice also display several behavioral abnormalities, including hyperactivity, disturbance in sensorimotor gating and olfactory-associated behavior, and an anhedonia/depression-like deficit.
Conflict of interest statement
The authors declare no conflict of interest.
Figures
Fig. 1.
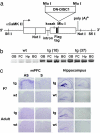
Production of DN-DISC1 tg mice. (a) Transgene construct. cDNA of DN-DISC1 was inserted into a modified pMM403 vector under the αCaMKII promoter. (b) DN-DISC1 transgene mRNA expression at the age of 2 months was assessed by RT-PCR. It was expressed in both tg lines in the following areas: OB, olfactory bulbs; FC, frontal cortex; Hp, hippocampus; BG, basal ganglia. (c) In situ hybridization on medial prefrontal cortex (mPFC) and hippocampus of tg line 37 at postnatal day 7 (P7) and at 3 months old (adult). AS, antisense probe; S, sense probe.
Fig. 2.
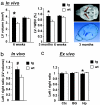
Anatomical changes of DN-DISC1 tg mice detected by MRI scans. (a) In vivo MRI scans. (Left) Lateral ventricles (LV) are enlarged in tg (n = 8) in comparison with wt (n = 7) (line 10, 6 weeks old) (*, F(1,13) = 7.70, P = 0.016). (Center) The ratio of the LV to the whole brain volume (WBV) is increased in tg (*, F(1,13) = 6.83, P = 0.022). (Right) A representative two-dimensional image (Upper) and a three-dimensional construction (Lower). (b) Left/right lateral ventricle volume ratio between tg (n = 7) and wt (n = 4) (#, suggestive at P = 0.057). (c) Ex vivo imaging. Ratio of left/right areas is significantly changed in hippocampus (Hp), but not in lateral cortex (Ctx) and basal ganglia (BG) between tg (n = 6) and wt (n = 6) (*, P < 0.05).
Fig. 3.
Immunostaining of interneurons in the medial prefrontal cortex. (a) (Left) High magnification representative pictures of staining patterns in the area marked in yellow in Right. (Right) Low magnification image demonstrating the area for the quantitative analyses, outlined in red. (b) Quantification of the staining. There was a significant reduction (**, P = 0.0059) in the number of parvalbumin (PV) cells in DN-DISC1 line 37 mice and no difference in calbindin (CB) or calretinin (CR) immunoreactivity.
Fig. 4.
Behavior assays. (a) tg mice are hyperactive. Results are shown for line 10 (line 37 behaved similarly). (Left) F(1,17) = 4.94, P = 0.04. (Center) Divided to 4 × 30 min intervals. DN-DISC1 mice were significantly hyperactive during the second hour of the test (*, 60–90 min: F(1,17) = 7.74, P = 0.013; 90–120 min: F(1,17) = 5.4, P = 0.033) (Right) tg mice reared more than wt mice. (b) tg display impaired prepulse inhibition when the 120-dB pulse was preceded by a prepulse of 74 dB. There is a significant interaction between genotype and prepulse intensity [F(4,68) = 5.18, P = 0.001]. (c) No significant difference between tg and wt in spatial working memory in a Y-maze paradigm, [F(1,24) = 0.087, P = 0.77]. The dotted line indicates chance performance level. (d) It takes longer for tg to find hidden food pellet (*, P = 0.038). (e) tg mice were immobile significantly longer than their wt littermates. ANOVA: F(1,20) = 8.66, P = 0.008.
Similar articles
- Inducible expression of mutant human DISC1 in mice is associated with brain and behavioral abnormalities reminiscent of schizophrenia.
Pletnikov MV, Ayhan Y, Nikolskaia O, Xu Y, Ovanesov MV, Huang H, Mori S, Moran TH, Ross CA. Pletnikov MV, et al. Mol Psychiatry. 2008 Feb;13(2):173-86, 115. doi: 10.1038/sj.mp.4002079. Epub 2007 Sep 11. Mol Psychiatry. 2008. PMID: 17848917 - Dominant negative DISC1 mutant mice display specific social behaviour deficits and aberration in BDNF and cannabinoid receptor expression.
Kaminitz A, Barzilay R, Segal H, Taler M, Offen D, Gil-Ad I, Mechoulam R, Weizman A. Kaminitz A, et al. World J Biol Psychiatry. 2014 Jan;15(1):76-82. doi: 10.3109/15622975.2013.841993. Epub 2013 Nov 13. World J Biol Psychiatry. 2014. PMID: 24219803 - Schizophrenia-related neural and behavioral phenotypes in transgenic mice expressing truncated Disc1.
Shen S, Lang B, Nakamoto C, Zhang F, Pu J, Kuan SL, Chatzi C, He S, Mackie I, Brandon NJ, Marquis KL, Day M, Hurko O, McCaig CD, Riedel G, St Clair D. Shen S, et al. J Neurosci. 2008 Oct 22;28(43):10893-904. doi: 10.1523/JNEUROSCI.3299-08.2008. J Neurosci. 2008. PMID: 18945897 Free PMC article. - Schizophrenia in translation: disrupted in schizophrenia (DISC1): integrating clinical and basic findings.
Roberts RC. Roberts RC. Schizophr Bull. 2007 Jan;33(1):11-5. doi: 10.1093/schbul/sbl063. Epub 2006 Nov 30. Schizophr Bull. 2007. PMID: 17138582 Free PMC article. Review. - Gene models of schizophrenia: DISC1 mouse models.
Jaaro-Peled H. Jaaro-Peled H. Prog Brain Res. 2009;179:75-86. doi: 10.1016/S0079-6123(09)17909-8. Epub 2009 Nov 20. Prog Brain Res. 2009. PMID: 20302820 Review.
Cited by
- Development and specification of GABAergic cortical interneurons.
Kelsom C, Lu W. Kelsom C, et al. Cell Biosci. 2013 Apr 23;3(1):19. doi: 10.1186/2045-3701-3-19. Cell Biosci. 2013. PMID: 23618463 Free PMC article. - Mutation of Semaphorin-6A disrupts limbic and cortical connectivity and models neurodevelopmental psychopathology.
Rünker AE, O'Tuathaigh C, Dunleavy M, Morris DW, Little GE, Corvin AP, Gill M, Henshall DC, Waddington JL, Mitchell KJ. Rünker AE, et al. PLoS One. 2011;6(11):e26488. doi: 10.1371/journal.pone.0026488. Epub 2011 Nov 21. PLoS One. 2011. PMID: 22132072 Free PMC article. - The adaptive significance of adult neurogenesis: an integrative approach.
Konefal S, Elliot M, Crespi B. Konefal S, et al. Front Neuroanat. 2013 Jul 16;7:21. doi: 10.3389/fnana.2013.00021. eCollection 2013. Front Neuroanat. 2013. PMID: 23882188 Free PMC article. - Balanced translocation linked to psychiatric disorder, glutamate, and cortical structure/function.
Thomson PA, Duff B, Blackwood DH, Romaniuk L, Watson A, Whalley HC, Li X, Dauvermann MR, Moorhead TW, Bois C, Ryan NM, Redpath H, Hall L, Morris SW, van Beek EJ, Roberts N, Porteous DJ, St Clair D, Whitcher B, Dunlop J, Brandon NJ, Hughes ZA, Hall J, McIntosh A, Lawrie SM. Thomson PA, et al. NPJ Schizophr. 2016 Aug 10;2:16024. doi: 10.1038/npjschz.2016.24. eCollection 2016. NPJ Schizophr. 2016. PMID: 27602385 Free PMC article. - Neurodevelopmental animal models of schizophrenia: role in novel drug discovery and development.
Wilson C, Terry AV Jr. Wilson C, et al. Clin Schizophr Relat Psychoses. 2010 Jul;4(2):124-37. doi: 10.3371/CSRP.4.2.4. Clin Schizophr Relat Psychoses. 2010. PMID: 20643635 Free PMC article. Review.
References
- Arguello PA, Gogos JA. Neuron. 2006;52:179–196. - PubMed
- Steinpresis RE. Behav Brain Res. 1996;74:45–55. - PubMed
- Chen J, Lipska BK, Weinberger DR. Biol Psychiatry. 2006;59:1180–1188. - PubMed
- Ishizuka K, Paek M, Kamiya A, Sawa A. Biol Psychiatry. 2006;59:1189–1197. - PubMed
- Porteous DJ, Thomson P, Brandon NJ, Millar JK. Biol Psychiatry. 2006;60:123–131. - PubMed
Publication types
MeSH terms
Substances
LinkOut - more resources
Full Text Sources
Other Literature Sources
Medical
Molecular Biology Databases


