Spatial learning depends on both the addition and removal of new hippocampal neurons - PubMed (original) (raw)
Spatial learning depends on both the addition and removal of new hippocampal neurons
David Dupret et al. PLoS Biol. 2007 Aug.
Abstract
The role of adult hippocampal neurogenesis in spatial learning remains a matter of debate. Here, we show that spatial learning modifies neurogenesis by inducing a cascade of events that resembles the selective stabilization process characterizing development. Learning promotes survival of relatively mature neurons, apoptosis of more immature cells, and finally, proliferation of neural precursors. These are three interrelated events mediating learning. Thus, blocking apoptosis impairs memory and inhibits learning-induced cell survival and cell proliferation. In conclusion, during learning, similar to the selective stabilization process, neuronal networks are sculpted by a tightly regulated selection and suppression of different populations of newly born neurons.
Conflict of interest statement
Competing interests. The authors have declared that no competing interests exist.
Figures
Figure 1. Spatial Learning in a Water Maze Increases Cell Death and Decreases Cell Genesis in the Dentate Gyrus
(A) Latency to find the escape platform. The syringes represent BrdU injections. (B–D) Apoptotic cell death measured by the number of fractin-IR cells (B), active-caspase-3-IR cells (C), and both pyknotic and karyorrhexic dying cells (Apoptotic cells) (D). (E) Cell genesis measured by the number of BrdU-IR cells. C, Control group; D, day; L, Learning group; Y, Yoked group. A single asterisk (*) indicates p ≤ 0.05, double asterisks (**) indicate p ≤ 0.01, and triple asterisks (***) indicate p ≤ 0.001 compared to Control. A single circle (°) indicates p ≤ 0.05, double circles (°°) indicate p ≤ 0.01 compared to Yoked. Error bars represent the standard error of the mean (s.e.m.).
Figure 2. Schematic Representation of the Main Experiment
Syringes represent XdU BrdU (gray), IdU (green), and CldU (blue) injections. Black arrows represent the time of sacrifice. Red squares represent intracerebroventricular infusions (zVAD or Vehicle).
Figure 3. Representative Examples of Apoptotic, Newborn, and Proliferative Cells
(A) Fractin-IR pyknotic cell. (B) Fractin-IR karyorrhexic cell. (C) Active-caspase-3-IR cell. (D) BrdU-IR cells. (E) Ki67-IR cells. (F) HH3-IR cell in anaphase. (G) BrdU-labeled cells (red) are stained with Dcx (green), a typical marker for immature newborn neurons. (H) Healthy BrdU-DAB-IR cell. (I) Pyknotic BrdU-DAB-IR cell. (J and K) Small BrdU-IR cell (red) exhibiting nuclear shrinkage using Fluoro Nissl Green counterstaining. Bar scales: (A–C), (F), and (H–K) indicate 5 μm; (D), (E), and (G) indicate 10 μm.
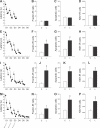
Figure 4. The Stabilization of Spatial Performances Increases Cell Death and Cell Proliferation in the Dentate Gyrus
(A, E, I, and M) Latency to find the escape platform. The syringes represent BrdU injections. D, day. (B, F, J, and N) Apoptosis measured by the number of fractin-IR cells. (C, G, K, and O) Apoptosis measured by the number of both pyknotic and karyorrhexic dying cells. (D, H, L, and P) Cell proliferation measured by the number of Ki67-IR cells. A single asterisk (*) indicates p ≤0.05, double asterisks (**) indicate p ≤ 0.01, and triple asterisks (***) indicate p ≤ 0.001 compared to Control groups. Error bars represent the s.e.m.
Figure 5. Spatial Learning Promotes the Death of Newborn Neurons Generated a Few Days before Training
(A) Latency to find the escape platform. Learning groups were injected with BrdU either 4 or 3 d before initiation of training as indicated by the syringes. D, day. (B) Newly born cells measured by the number of BrdU-IR cells. (C and D) Apoptotic cells measured by the number of fractin-IR cells (C) and both pyknotic and karyorrhexic dying cells (D). (E) Number of BrdU-IR cells exhibiting characteristics of dying cells. (F) Percentage of BrdU-IR cells expressing the immature neuronal marker Dcx. (G) Extrapolated number of newborn neurons. A single asterisk (*) indicates p ≤ 0.05, double asterisks (**) indicate p ≤ 0.01, and triple asterisks (***) indicate p ≤ 0.001 compared to Control groups. Error bars represent the s.e.m.
Figure 6. zVAD Infusion Blocks Learning-Induced Cell Death and Impedes Spatial Memory
(A) Latency to reach the hidden platform in animals infused with zVAD (•) or vehicle (○). The dashed line represents the mean escape latency across the first four training days. (B) Memory of platform location during a probe test (seventh day of testing) measured by the time spent in the target quadrant (open bar). A single asterisk (*) indicates p ≤ 0.05. (C) Spatial histograms of the animals' locations and examples of swim paths to reach the platform location during the probe test (see Protocol S1 for more information). (D and E) Effects of zVAD (filled bars) and vehicle (open bars) treatments on cell death measured by the number of fractin-IR cells (D) and both pyknotic and karyorrhexic dying cells (E). (F and G) Effects of zVAD (filled bars) and vehicle (open bars) treatments on cell proliferation measured by the number of Ki67-IR cells (F) and HH3-IR cells (G). A single asterisk (*) indicates p ≤ 0.05, double asterisks (**) indicate p ≤ 0.01, and triple asterisks (***) indicate p ≤ 0.001, zVAD group compared to Veh group; a single circle (°) indicates p ≤ 0.05, and triple circles (°°°) indicate p ≤ 0.001, Learning group (L) compared to Control group (C). Error bars represent the s.e.m
Figure 7. Learning Increases the Number of New Neurons, and This Effect Is Blocked by zVAD Infusion
(A) Latency to reach the hidden platform in animals infused with zVAD (•) or vehicle (○). The dashed line represents the mean escape latency across the first four training days. The syringes represent IdU and CldU injections. D, day. (B) Effects of zVAD (filled bars) and vehicle (open bars) treatments on the survival of IdU-IR cells generated 7 d before exposure to the task. (C) Effects of zVAD (filled bars) and vehicle (open bars) treatments on the number of IdU-IR cells exhibiting characteristics of pyknotic cells. (D) Effects of zVAD (filled bars) and vehicle (open bars) treatments on the survival of CldU-IR cells generated 3 d before exposure to the task. (E) Effects of zVAD (filled bars) and vehicle (open bars) treatments on the number of CldU-IR cells exhibiting characteristics of pyknotic cells. A single asterisk (*) indicates p ≤ 0.05, double asterisks (**) indicate p ≤ 0.01, and triple asterisks (***) indicate p ≤ 0.001, zVAD group compared to Veh group; a single circle (°) indicates p ≤ 0.05, double circles (°°) indicate p ≤ 0.01, and triple circles (°°°) indicate p ≤ 0.001, Learning group (L) compared to Control group (C) .
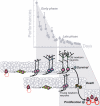
Figure 8. Spatial Learning Depends upon a Selective Stabilization Process Where the Production of New Neurons Is Followed by an Active and Selective Removal of Others
The early phase of learning in the water maze, characterized by a fast improvement in performance, increases the survival of newborn neurons that were produced 1 wk before exposure to the task. Once the task has begun to be mastered, during the late phase of learning, learning induces apoptosis of newborn neurons that are a few days younger than the ones for which survival has been increased. This wave of cell death is followed by an increase in cell proliferation. Learning-induced apoptosis plays a pivotal role in this intermingled chain of events since it is necessary for the survival of the older, newly born neurons, but also for the increase in cell proliferation occurring during the late phase of learning.
Similar articles
- Strain differences in neurogenesis and activation of new neurons in the dentate gyrus in response to spatial learning.
Epp JR, Scott NA, Galea LA. Epp JR, et al. Neuroscience. 2011 Jan 13;172:342-54. doi: 10.1016/j.neuroscience.2010.10.025. Epub 2010 Oct 16. Neuroscience. 2011. PMID: 20955769 - Induction of neurogenesis in the adult dentate gyrus by cortical spreading depression.
Urbach A, Redecker C, Witte OW. Urbach A, et al. Stroke. 2008 Nov;39(11):3064-72. doi: 10.1161/STROKEAHA.108.518076. Epub 2008 Sep 18. Stroke. 2008. PMID: 18802207 - Effect of long-lasting serotonin depletion on environmental enrichment-induced neurogenesis in adult rat hippocampus and spatial learning.
Ueda S, Sakakibara S, Yoshimoto K. Ueda S, et al. Neuroscience. 2005;135(2):395-402. doi: 10.1016/j.neuroscience.2005.06.065. Neuroscience. 2005. PMID: 16125851 - Review: adult neurogenesis contributes to hippocampal plasticity.
Toda T, Gage FH. Toda T, et al. Cell Tissue Res. 2018 Sep;373(3):693-709. doi: 10.1007/s00441-017-2735-4. Epub 2017 Nov 29. Cell Tissue Res. 2018. PMID: 29185071 Review. - Is there a link between adult neurogenesis and learning?
Leuner B, Gould E, Shors TJ. Leuner B, et al. Hippocampus. 2006;16(3):216-24. doi: 10.1002/hipo.20153. Hippocampus. 2006. PMID: 16421862 Review.
Cited by
- Repeated Ketamine Anesthesia during the Neonatal Period Impairs Hippocampal Neurogenesis and Long-Term Neurocognitive Function by Inhibiting Mfn2-Mediated Mitochondrial Fusion in Neural Stem Cells.
Huang H, Wang N, Lin JT, Qiu YK, Wu WF, Liu Q, Chen C, Wang HB, Liu YP, Dong W, Wan J, Zheng H, Zhou CH, Wu YQ. Huang H, et al. Mol Neurobiol. 2024 Aug;61(8):5459-5480. doi: 10.1007/s12035-024-03921-2. Epub 2024 Jan 10. Mol Neurobiol. 2024. PMID: 38200350 - Neural stem cell- and neurogenesis-related gene expression profiles in the young and aged dentate gyrus.
Shetty GA, Hattiangady B, Shetty AK. Shetty GA, et al. Age (Dordr). 2013 Dec;35(6):2165-76. doi: 10.1007/s11357-012-9507-6. Epub 2013 Jan 16. Age (Dordr). 2013. PMID: 23322452 Free PMC article. - Regulation of Adult Neurogenesis by the Fragile X Family of RNA Binding Proteins.
Patzlaff NE, Shen M, Zhao X. Patzlaff NE, et al. Brain Plast. 2018 Aug 10;3(2):205-223. doi: 10.3233/BPL-170061. Brain Plast. 2018. PMID: 30151344 Free PMC article. Review. - A role for hippocampal PSA-NCAM and NMDA-NR2B receptor function in flavonoid-induced spatial memory improvements in young rats.
Rendeiro C, Foley A, Lau VC, Ring R, Rodriguez-Mateos A, Vauzour D, Williams CM, Regan C, Spencer JP. Rendeiro C, et al. Neuropharmacology. 2014 Apr;79(100):335-44. doi: 10.1016/j.neuropharm.2013.12.003. Epub 2013 Dec 11. Neuropharmacology. 2014. PMID: 24333331 Free PMC article. - A time to remember: the role of circadian clocks in learning and memory.
Smarr BL, Jennings KJ, Driscoll JR, Kriegsfeld LJ. Smarr BL, et al. Behav Neurosci. 2014 Jun;128(3):283-303. doi: 10.1037/a0035963. Epub 2014 Apr 7. Behav Neurosci. 2014. PMID: 24708297 Free PMC article. Review.
References
- Ramon y Cajal S. In: Cajal's degeneration and regeneration of the nervous system. DeFelipe J, Jones EG, editors. New York: Oxford University Press; 1991. 766 May RM, translator;
- Altman J. Are new neurones formed in the brains of adult mammals? Science. 1962;135:1127–1128. - PubMed
- Gross CG. Neurogenesis in the adult brain: Death of a dogma. Nat Rev Neurosci. 2000;1:67–73. - PubMed
- Abrous DN, Koehl M, Le Moal M. Adult neurogenesis: From precursors to network and physiology. Physiol Rev. 2005;85:523–569. - PubMed
- Cameron HA, McKay RD. Adult neurogenesis produces a large pool of new granule cells in the dentate gyrus. J Comp Neurol. 2001;435:406–417. - PubMed
Publication types
MeSH terms
LinkOut - more resources
Full Text Sources
Other Literature Sources


