CD38 expression labels an activated subset within chronic lymphocytic leukemia clones enriched in proliferating B cells - PubMed (original) (raw)
Comparative Study
CD38 expression labels an activated subset within chronic lymphocytic leukemia clones enriched in proliferating B cells
Rajendra N Damle et al. Blood. 2007.
Abstract
Chronic lymphocytic leukemia (CLL) cells are thought to have diminished cell-cycling capacity, a view challenged by their phenotypic resemblance to activated human B lymphocytes. The present study addresses the cell-cycling status of CLL cells, focusing on those leukemic cells expressing CD38, a molecule involved in signaling and activation that also serves as a prognostic marker in this disease. CD38(+) and CD38(-) members of individual CLL clones were analyzed for coexpression of molecules associated with cellular activation (CD27, CD62L, and CD69), cell-cycle entry (Ki-67), signaling (ZAP-70), and protection from apoptosis (telomerase and Bcl-2). Regardless of the size of the CD38(+) fraction within a CLL clone, CD38(+) subclones are markedly enriched for expression of Ki-67, ZAP-70, human telomerase reverse transcriptase, and telomerase activity. Although the percentage of cells (approximately 2%) entering the cell cycle as defined by Ki-67 expression is small, the absolute number within a clone can be sizeable and is contained primarily within the CD38(+) fraction. Despite these activation/proliferation differences, both CD38(+) and CD38(-) fractions have similar telomere lengths, suggesting that CD38 expression is dynamic and transient. These findings may help explain why high percentages of CD38(+) cells within clones are associated with poor clinical outcome.
Figures
Figure 1
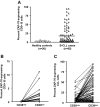
Ki-67 expression in CD5+ B cells from healthy elderly donors and patients with CLL. PBMCs from 20 healthy elderly donors and 95 patients with CLL were analyzed for expression of CD5, CD38, CD19, and Ki-67. (A) Percentage of CD5+CD19+ cells from healthy controls and patients with CLL expressing Ki-67 (P < .001; Mann-Whitney test). (B) Percentage of CD38+ B cells in CLL clones designated CD38low (55 of 95) and CD38high (40 of 95) based on a 30% cut-off. (C) Significant differences in Ki-67 expression between CD38low and CD38high patients with CLL (P < .001; Mann-Whitney test). Horizontal lines in panels A and B indicate averages of values in corresponding groups.
Figure 2
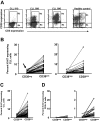
Ki-67 expression by CD38+ and CD38− B cells within individual patients with CLL. PBMCs from 95 patients with CLL and 20 elderly healthy donors were stained as in Figure 1. (A) Dotplots of CD5 and CD38 expression by B cells from 3 patients with CLL and 1 healthy donor. (B) Left panel: Lines connect data points for percentage of Ki-67+ cells in CD38− and CD38+ subsets within each patients with CLL in the CD38low subgroup. Note the detection of Ki-67+ cells even in the CD38− subset of CD38low patients (arrow). Right panel: Lines connect data points for percentage of Ki-67+ cells in CD38− and CD38+ subsets within each CLL clone in the CD38high subgroup. (C) Lines connect data points for percentage of Ki-67+ cells in CD38− and CD38+ subsets of all patients with CLL. (D) Left panel: Lines connect data points for percentage of Ki-67+ cells in CD38− and CD38+ subsets within each healthy participant. Right panel: Same data from left graph drawn to a smaller scale.
Figure 3
Ki-67 expression in relation to density of CD38. PBMCs from patients with CLL were stained as described for Figure 1, and contour plots depicting expression of CD5 and CD38 in CD19+ cells of patients with CLL were generated. (A) The CD38+ fraction was divided into 3 regions—R4, R5, and R6—referred to as CD38low, CD38int, and CD38high, respectively. Percentages of Ki-67–expressing cells were scored only if at least 50 cells fell within marked regions. (B) Percentages of Ki-67–expressing cells in CD38low, CD38int, and CD38high subsets from 60 of 95 patients with CLL. Horizontal lines indicate averages of values in corresponding populations. (C) Average (± SE) of values from panel B. (D) Lines connect data points depicting percent Ki-67+ cells in each CD38 subset for each of 60 patients with CLL. (E) In every patient studied, CD5+Ki-67+ cells showed higher density of CD38 compared with CD5+Ki-67− cells from the same case.
Figure 4
Expression of cell activation- and apoptosis- related molecules in CD38+ and CD38− cell subsets within patients with CLL. PBMCs from 50 patients with CLL were analyzed for expression of CD27, CD62L, or CD69 by CD5+, CD19+, and CD38+ cells. (A-C) Significant differences in expression of CD27, CD62L, and CD69, respectively, within CD38+ and CD38− subsets of the clone (CD27 and CD62L, P < .001; CD69, P < .01). (D) Means (± SE) for percentage of Bcl-2+ cells (left) and means (± SE) for MFI of Bcl-2 expression (right).
Figure 5
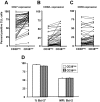
ZAP-70 expression in CD38+ and CD38− cells. PBMCs from 20 elderly healthy donors and 95 patients with CLL were incubated with mAbs to CD5, CD38, CD19, ZAP-70, or appropriate isotype control mAbs. CD19+CD5+ cells exhibiting a ZAP-70 staining in excess of the isotype control mAbs were considered ZAP-70+. (A) Significant differences in percentage of CD5+CD19+ cells expressing ZAP-70 (P < .001; Mann-Whitney test). These data were further analyzed to determine differences in expression of ZAP-70 between the CD38− and CD38+ populations in healthy controls. Horizontal line indicates average of values in corresponding group. (B) and in patients with CLL (C). Significant differences exist between ZAP-70 expression within CD38− and CD38+ subsets from healthy donors and patients with CLL (P < .001; Kruskal-Wallis test).
Figure 6
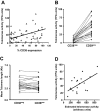
Telomerase activity and telomere length of flow-sorted populations. (A) Telomerase activity was assayed in B cells from 60 patients with CLL using the TRAP assay and percentage of CD38+ CLL cells plotted versus TPG (total product generated) units in the same patients. CD19+CD5+ cells from 20 patients with CLL were sorted into CD38+ and CD38− subpopulations and processed for quantification of telomere length and telomerase activity. (B) Lines connect data points that indicate telomerase activity in the cell subsets of each individual patient. (C) Lines connect data points for mean telomere lengths of flow-sorted CD38+ and CD38− CLL cells. (D) Significant positive correlation (r = .465; P < .045) exists between estimated telomerase activity and observed telomerase activity (TPG units) in CD38+ cells from 20 patients with CLL shown in panels B and C; this correlation does not exist in the CD38− cells. Diagonal lines in panels A and D indicate best fits based on linear regression of data.
Similar articles
- In vivo intraclonal and interclonal kinetic heterogeneity in B-cell chronic lymphocytic leukemia.
Calissano C, Damle RN, Hayes G, Murphy EJ, Hellerstein MK, Moreno C, Sison C, Kaufman MS, Kolitz JE, Allen SL, Rai KR, Chiorazzi N. Calissano C, et al. Blood. 2009 Nov 26;114(23):4832-42. doi: 10.1182/blood-2009-05-219634. Epub 2009 Sep 29. Blood. 2009. PMID: 19789386 Free PMC article. - The activity of atorvastatin and rosiglitazone on CD38, ZAP70 and apoptosis in lymphocytes of B-cell chronic lymphocytic leukemia in vitro.
Yavasoglu I, Sargin G, Kadikoylu G, Karul A, Bolaman Z. Yavasoglu I, et al. Med Oncol. 2013;30(3):603. doi: 10.1007/s12032-013-0603-y. Epub 2013 May 19. Med Oncol. 2013. PMID: 23686733 - ZAP-70 protein expression and CD38 positivity in B-cell chronic lymphocytic leukemia.
Ertault-Daneshpouy M, Noguera ME, Gisselbrecht C, Haddad A, Brice P, Marolleau JP, Soulier J, Mounier N. Ertault-Daneshpouy M, et al. Clin Adv Hematol Oncol. 2008 Jan;6(1):55-63. Clin Adv Hematol Oncol. 2008. PMID: 18322442 - In-tandem insight from basic science combined with clinical research: CD38 as both marker and key component of the pathogenetic network underlying chronic lymphocytic leukemia.
Deaglio S, Vaisitti T, Aydin S, Ferrero E, Malavasi F. Deaglio S, et al. Blood. 2006 Aug 15;108(4):1135-44. doi: 10.1182/blood-2006-01-013003. Epub 2006 Apr 18. Blood. 2006. PMID: 16621959 Review. - CD38 and chronic lymphocytic leukemia: a decade later.
Malavasi F, Deaglio S, Damle R, Cutrona G, Ferrarini M, Chiorazzi N. Malavasi F, et al. Blood. 2011 Sep 29;118(13):3470-8. doi: 10.1182/blood-2011-06-275610. Epub 2011 Jul 15. Blood. 2011. PMID: 21765022 Free PMC article. Review.
Cited by
- Lymphoblastoid cell line with B1 cell characteristics established from a chronic lymphocytic leukemia clone by in vitro EBV infection.
Rosén A, Bergh AC, Gogok P, Evaldsson C, Myhrinder AL, Hellqvist E, Rasul A, Björkholm M, Jansson M, Mansouri L, Liu A, Teh BT, Rosenquist R, Klein E. Rosén A, et al. Oncoimmunology. 2012 Jan 1;1(1):18-27. doi: 10.4161/onci.1.1.18400. Oncoimmunology. 2012. PMID: 22720208 Free PMC article. - Stromal endothelial cells establish a bidirectional crosstalk with chronic lymphocytic leukemia cells through the TNF-related factors BAFF, APRIL, and CD40L.
Cols M, Barra CM, He B, Puga I, Xu W, Chiu A, Tam W, Knowles DM, Dillon SR, Leonard JP, Furman RR, Chen K, Cerutti A. Cols M, et al. J Immunol. 2012 Jun 15;188(12):6071-83. doi: 10.4049/jimmunol.1102066. Epub 2012 May 16. J Immunol. 2012. PMID: 22593611 Free PMC article. - The pathogenesis of chronic lymphocytic leukemia.
Zhang S, Kipps TJ. Zhang S, et al. Annu Rev Pathol. 2014;9:103-18. doi: 10.1146/annurev-pathol-020712-163955. Epub 2013 Aug 26. Annu Rev Pathol. 2014. PMID: 23987584 Free PMC article. Review. - Torque teno virus 10 isolated by genome amplification techniques from a patient with concomitant chronic lymphocytic leukemia and polycythemia vera.
Chu CC, Zhang L, Dhayalan A, Agagnina BM, Magli AR, Fraher G, Didier S, Johnson LP, Kennedy WJ, Damle RN, Yan XJ, Patten PE, Teichberg S, Koduru P, Kolitz JE, Allen SL, Rai KR, Chiorazzi N. Chu CC, et al. Mol Med. 2011;17(11-12):1338-48. doi: 10.2119/molmed.2010.00110. Epub 2011 Sep 21. Mol Med. 2011. PMID: 21953418 Free PMC article. - Gene expression signatures of radiation response are specific, durable and accurate in mice and humans.
Meadows SK, Dressman HK, Muramoto GG, Himburg H, Salter A, Wei Z, Ginsburg GS, Chao NJ, Nevins JR, Chute JP. Meadows SK, et al. PLoS One. 2008 Apr 2;3(4):e1912. doi: 10.1371/journal.pone.0001912. PLoS One. 2008. PMID: 18382685 Free PMC article.
References
- Damle RN, Wasil T, Fais F, et al. Ig V gene mutation status and CD38 expression as novel prognostic indicators in chronic lymphocytic leukemia. Blood. 1999;94:1840–1847. - PubMed
- Wiestner A, Rosenwald A, Barry TS, et al. ZAP-70 expression identifies a chronic lymphocytic leukemia subtype with unmutated immunoglobulin genes, inferior clinical outcome, and distinct gene expression profile. Blood. 2003;101:4944–4951. - PubMed
- Dohner H, Stilgenbauer S, Benner A, et al. Genomic aberrations and survival in chronic lymphocytic leukemia. N Engl J Med. 2000;343:1910–1916. - PubMed
Publication types
MeSH terms
Substances
LinkOut - more resources
Full Text Sources
Other Literature Sources
Research Materials


