The proapoptotic factors Bax and Bak regulate T Cell proliferation through control of endoplasmic reticulum Ca(2+) homeostasis - PubMed (original) (raw)
doi: 10.1016/j.immuni.2007.05.023. Epub 2007 Aug 9.
Thi Bui, Carl White, Muniswamy Madesh, Connie M Krawczyk, Tullia Lindsten, Brian J Hawkins, Sara Kubek, Kenneth A Frauwirth, Y Lynn Wang, Stuart J Conway, H Llewelyn Roderick, Martin D Bootman, Hao Shen, J Kevin Foskett, Craig B Thompson
Affiliations
- PMID: 17692540
- PMCID: PMC2714273
- DOI: 10.1016/j.immuni.2007.05.023
The proapoptotic factors Bax and Bak regulate T Cell proliferation through control of endoplasmic reticulum Ca(2+) homeostasis
Russell G Jones et al. Immunity. 2007 Aug.
Abstract
The Bcl-2-associated X protein (Bax) and Bcl-2-antagonist/killer (Bak) are essential regulators of lymphocyte apoptosis, but whether they play a role in viable T cell function remains unclear. Here, we report that T cells lacking both Bax and Bak display defects in antigen-specific proliferation because of Ca(2+)-signaling defects. Bax(-/-), Bak(-/-) T cells displayed defective T cell receptor (TCR)- and inositol-1,4,5-trisphosphate (IP(3))-dependent Ca(2+) mobilization because of altered endoplasmic reticulum (ER) Ca(2+) regulation that was reversed by Bax's reintroduction. The ability of TCR-dependent Ca(2+) signals to stimulate mitochondrial NADH production in excess of that utilized for ATP synthesis was dependent on Bax and Bak. Blunting of Ca(2+)-induced mitochondrial NADH elevation in the absence of Bax and Bak resulted in decreased reactive-oxygen-species production, which was required for T cell proliferation. Together, the data establish that Bax and Bak play an essential role in the control of T cell proliferation by modulating ER Ca(2+) release.
Figures
Figure 1
Bax and Bak are required for T cell activation and apoptosis. (A, B) Proliferation of peripheral T cells isolated from _rag1_-/- animals reconstituted with wild-type (WT, closed circles) or _bax_-/-_bak_-/- (DKO, open circles) bone marrow. T cells were stimulated with plate-bound anti-CD3 antibody alone (A) or in combination with 1 μg/ml anti-CD28 antibody (B), and proliferation was measured on day 3 post-activation. 3[H]-thymidine was added during the last 12 hours of culture. Each data point represents the mean ± s.d. for triplicate cultures, and is representative of four independent experiments. (C) CFSE profile of WT and DKO CD4+ T cells as measured by flow cytometry 3 days following activation with soluble anti-CD3 antibody (0.5 μg/ml). Data are representative of three independent experiments. (D) Surface expression of CD25 and CD69 on WT and DKO CD4+ T cells one day following activation with anti-CD3 (solid line) or anti-CD3 plus anti-CD28 antibodies (broken line) as determined by flow cytometry. CD25 and CD69 surface staining of unstimulated cells is depicted by the gray histogram. Data are representative of two independent experiments. (E) T cell viability under conditions of cytokine withdrawal. WT (filled bars) and DKO (open bars) T cells were activated with anti-CD3 and anti-CD28 antibodies for 3 days, then washed and re-plated in fresh medium with no exogenous cytokines. Cell viability was measured by exclusion of propidium iodide (PI) by flow cytometry. Data represent the mean ± s.d. for samples in triplicate from one of three independent experiments. (F) T cell viability in response to apoptotic stimuli. WT and DKO T cells were activated as in (E) and then subjected to various apoptotic stimuli: γ radiation (500 rad), doxorubicin (2 μg/ml), or H2O2 (100 μM). Untr, untreated. Percent viable cells was determined by PI exclusion and expressed as mean ±s.d. for triplicate cultures.
Figure 2
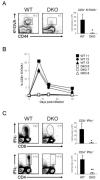
Impaired in vivo T cell responses to L monocytogenes infection in bax -/-bak-/- chimeric mice. (A) Flow cytometry of splenocytes from WT or DKO chimeric animals 7 days following i.v. infection with recombinant L monocytogenes expressing OVA (rLmOVA, 5e4 CFU). Numbers above gate indicate the percent OVA-specific cells as determined by tetramer staining on CD8+ cells. The bar graph indicates the total number of Kb/OVA257-264-specific CD8+ cells per WT (closed bar) or DKO (open bar) spleen (n = 3 per genotype). The data represent one of three independent experiments. (B) Percentage of OVA-specific CD8+ T cells in blood of WT (closed symbols) or DKO (open symbols) animals over time following infection with rLmOVA as determined by tetramer staining and flow cytometry. Each symbol represents one mouse. (C) Cytokine production as assessed by intracellular staining (ICS) and flow cytometry. Splenocytes from day 7 infected WT or DKO animals were restimulated with OVA257–264 or LLO190–201 peptides (for CD8+ and CD4+ T cells, respectively) in the presence of GolgiStop and examined for IFNγ production by ICS and flow cytometry. Numbers above gates indicate percent IFNγ-producing cells in spleen. Bar graphs indicate the total number of IFNγ-producing CD8+ and CD4+ T cells per spleen (n = 3 per genotype). Data represent one of three independent experiments. Statistical significance was determined by paired Student's t-test (* p<0.05, **, p<0.01).
Figure 3
Impaired [Ca2+]i signaling in DKO T cells. (A) [Ca2+]i of WT or DKO T cells following TCR stimulation. CD4+ T cells were incubated with fluo-4 dye and anti-CD3 antibody, washed, and plated on coverslips. Changes in [Ca2+]i were measured by fluorescence microscopy following anti-CD3 crosslinking (indicated by arrow) and expressed as a function of time. Inset, representative fields depicting [Ca2+]i of WT or DKO T cells with (+) or without (-) anti-CD3 crosslinking. (B-C) Immunoblot analysis of phosphorylated Erk (B) or PLCγ1 (C) in lysates from WT or DKO T cells stimulated for the indicated times with anti-CD3 antibody (10 μg/ml). (D) [Ca2+]i of WT or DKO T cells following stimulation with 10 μM IP3 ester. T cells were loaded with indo-1 dye, and [Ca2+]i measured by flow cytometry. (E-F) [Ca2+]i of WT or DKO T cells following thapsigargin (Tg) treatment. [Ca2+]i of CD4+ T cells was measured following application of Tg in Ca2+-free buffer containing 1 mM EGTA (E), then following switching to 1.8 mM Ca2+ solution (F). The data represent mean ± SEM for at least 90 cells from multiple trials.
Figure 4
DKO T cells display changes in TCR-induced [Ca2+]i oscillations. (A) Representative traces of WT (black) and DKO (red) T cells displaying [Ca2+]i oscillations following stimulation with anti-CD3 antibody. CD4+ T cells were loaded with fura-2 dye, plated onto anti-CD3 coated coverslips, and [Ca2+]I measured by epifluorescence microscopy. Time t=0 represents the point of contact between T cell and coverslip. (B) Scatter plot showing the relationship between mean [Ca2+]i for the spikes observed during a 50 minute observation period and spike frequency for WT (black) or DKO (red) T cells following activation with anti-CD3 antibody. Each data point represents the response of one cell. (C) [Ca2+]i spike amplitude histograms for WT and DKO T cells following anti-CD3 stimulation. (D) Average integrated [Ca2+]i responses for WT or DKO T cells following anti-CD3 stimulation. Data were calculated from traces of 96 WT and 87 DKO T cells that responded to anti-CD3 stimulation with one or more [Ca2+]i spikes over 50 minutes. The data are representative of four independent experiments.
Figure 5
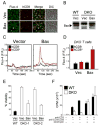
Re-expression of Bax rescues the Ca2+ mobilization defect of DKO T cells. (A) Transduction of DKO T cells with Bax retrovirus. CD4+ T cells from DKO chimeric mice were transduced with empty hCD8-Mig retrovirus (Vec) or retrovirus encoding Bax. Cells were incubated with fluo-4 dye, PE-tagged antibody against hCD8, and anti-CD3 antibody, washed, and plated on coverslips. A representative field of view from confocal imaging is displayed. (B) Western blot of Bax expression in WT or DKO CD4+ T cells transduced with empty hCD8-Mig retrovirus (Vec) or retrovirus encoding Bax. (C) [Ca2+]i of DKO T cells re-expressing Bax. Changes in [Ca2+]i were measured by confocal microscopy following anti-CD3 crosslinking and expressed as a function of time. The traces represent the [Ca2+]i for the population of non-transduced (hCD8-, black) and transduced (hCD8+, red) cells within one field of view. (D) Quantitation of peak [Ca2+]i following anti-CD3 crosslinking for T cells in (C). The data represent the mean ± SEM for T cells from three independent mice. (E) Viability of DKO T cells re-expressing Bax following cytokine withdrawal. WT (filled bars) and DKO (open bars) T cells transduced with empty hCD8-Mig retrovirus (Vec) or retrovirus encoding Bax were cultured in medium containing no exogenous cytokines. Cell viability was determined by trypan blue exclusion 72 hours following cytokine withdrawal for T cells from two independent DKO chimeric mice. The data represent the mean ± s.d. for samples in triplicate. (F) Ionomycin rescues the proliferative defect of DKO T cells. Proliferation of WT (closed bars) or DKO (open bars) T cells stimulated with anti-CD3 or anti-CD3 plus anti-CD28 antibody (1 μg/ml) in the presence or absence of ionomycin (250 ng/ml). Proliferation was measured 3 days after stimulation by 3[H]-thymidine incorporation. The data are representative of three independent experiments.
Figure 6
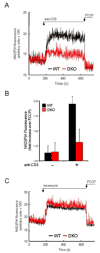
DKO T cells are defective for TCR-dependent mitochondrial NADH production. (A) NAD(P)H fluorescence of WT (black) or DKO (red) T cells over time following anti-CD3 crosslinking. The mitochondrial uncoupling agent FCCP (1 μg/ml) was added as indicated. (B) Mitochondrial NAD(P)H fluorescence before (-) or after (+) anti-CD3 crosslinking. Data are expressed as fold increase over FCCP-treated T cells. (C) NAD(P)H fluorescence of WT (black) or DKO (red) T cells over time following treatment with ionomycin (250 ng/ml). FCCP was added as indicated.
Figure 7
TCR-induced ROS generation is impaired in DKO T cells. (A) Oxidation of the ROS-sensitive dye DCF-DA in WT or DKO T cells following anti-CD3 crosslinking. Top panel displays representative fields of view for cells undergoing DCF oxidation (green) before (-) and after (+) anti-CD3 crosslinking. Phase contrast view for the same field is shown. (B) Quantification of DCF oxidation for WT (black) or DKO (red) T cells following anti-CD3 treatment as in (A). ROS production by T cells was measured following anti-CD3 crosslinking alone or in combination with ionomycin (250 ng/ml). The data represent the mean ± s.d. for triplicate samples, and is representative of three independent experiments. (C) Bax re-expression restores TCR-induced ROS production by DKO T cells. Quantification of DCF dye oxidation following anti-CD3 crosslinking in WT (black) or DKO (red) T cells transduced with empty vector (Vec) or Bax. The data are representative of two independent experiments. (D) Proliferation of T cells in the presence of inhibitors of ROS production. Purified T cells from wild-type animals were left unstimulated or stimulated with anti-CD3 and anti-CD28 antibodies in the presence of increasing concentrations of DPI, BHA, Ebselen, or NAC. Proliferation was measured by 3[H]-thymidine incorporation 48 hours after activation. The data represent the mean ± s.d. for triplicate samples, and is representative of three independent experiments. (E) Proliferation of WT (black) or DKO (white) T cells stimulated with anti-CD3 or anti-CD3 plus ionomycin in the presence or absence of DPI (100 nM). Data are expressed as mean ± s.d. for triplicate samples, and is representative of two independent experiments.
Comment in
- Revving the engine: signal transduction fuels T cell activation.
Jones RG, Thompson CB. Jones RG, et al. Immunity. 2007 Aug;27(2):173-8. doi: 10.1016/j.immuni.2007.07.008. Immunity. 2007. PMID: 17723208
Similar articles
- Proapoptotic BAX and BAK regulate the type 1 inositol trisphosphate receptor and calcium leak from the endoplasmic reticulum.
Oakes SA, Scorrano L, Opferman JT, Bassik MC, Nishino M, Pozzan T, Korsmeyer SJ. Oakes SA, et al. Proc Natl Acad Sci U S A. 2005 Jan 4;102(1):105-10. doi: 10.1073/pnas.0408352102. Epub 2004 Dec 21. Proc Natl Acad Sci U S A. 2005. PMID: 15613488 Free PMC article. - Inhibition of the ER Ca2+ pump forces multidrug-resistant cells deficient in Bak and Bax into necrosis.
Janssen K, Horn S, Niemann MT, Daniel PT, Schulze-Osthoff K, Fischer U. Janssen K, et al. J Cell Sci. 2009 Dec 15;122(Pt 24):4481-91. doi: 10.1242/jcs.055772. Epub 2009 Nov 17. J Cell Sci. 2009. PMID: 19920074 - ROS mediated ER stress induces Bax-Bak dependent and independent apoptosis in response to Thioridazine.
Seervi M, Rani A, Sharma AK, Santhosh Kumar TR. Seervi M, et al. Biomed Pharmacother. 2018 Oct;106:200-209. doi: 10.1016/j.biopha.2018.06.123. Epub 2018 Jun 28. Biomed Pharmacother. 2018. PMID: 29960166 - Regulation of endoplasmic reticulum Ca2+ dynamics by proapoptotic BCL-2 family members.
Oakes SA, Opferman JT, Pozzan T, Korsmeyer SJ, Scorrano L. Oakes SA, et al. Biochem Pharmacol. 2003 Oct 15;66(8):1335-40. doi: 10.1016/s0006-2952(03)00482-9. Biochem Pharmacol. 2003. PMID: 14555206 Review. - Deficiency in apoptotic effectors Bax and Bak reveals an autophagic cell death pathway initiated by photodamage to the endoplasmic reticulum.
Buytaert E, Callewaert G, Vandenheede JR, Agostinis P. Buytaert E, et al. Autophagy. 2006 Jul-Sep;2(3):238-40. doi: 10.4161/auto.2730. Epub 2006 Jul 22. Autophagy. 2006. PMID: 16874066 Review.
Cited by
- T cell metabolism drives immunity.
Buck MD, O'Sullivan D, Pearce EL. Buck MD, et al. J Exp Med. 2015 Aug 24;212(9):1345-60. doi: 10.1084/jem.20151159. Epub 2015 Aug 10. J Exp Med. 2015. PMID: 26261266 Free PMC article. Review. - Bcl-2 interaction with the inositol 1,4,5-trisphosphate receptor: role in Ca(2+) signaling and disease.
Distelhorst CW, Bootman MD. Distelhorst CW, et al. Cell Calcium. 2011 Sep;50(3):234-41. doi: 10.1016/j.ceca.2011.05.011. Epub 2011 May 31. Cell Calcium. 2011. PMID: 21628070 Free PMC article. Review. - Exosome-derived circTRPS1 promotes malignant phenotype and CD8+ T cell exhaustion in bladder cancer microenvironments.
Yang C, Wu S, Mou Z, Zhou Q, Dai X, Ou Y, Chen X, Chen Y, Xu C, Hu Y, Zhang L, Zou L, Jin S, Hu J, Mao S, Jiang H. Yang C, et al. Mol Ther. 2022 Mar 2;30(3):1054-1070. doi: 10.1016/j.ymthe.2022.01.022. Epub 2022 Jan 14. Mol Ther. 2022. PMID: 35038580 Free PMC article. - Immune cell - produced ROS and their impact on tumor growth and metastasis.
Kennel KB, Greten FR. Kennel KB, et al. Redox Biol. 2021 Jun;42:101891. doi: 10.1016/j.redox.2021.101891. Epub 2021 Feb 5. Redox Biol. 2021. PMID: 33583736 Free PMC article. Review. - Ca2+ signals regulate mitochondrial metabolism by stimulating CREB-mediated expression of the mitochondrial Ca2+ uniporter gene MCU.
Shanmughapriya S, Rajan S, Hoffman NE, Zhang X, Guo S, Kolesar JE, Hines KJ, Ragheb J, Jog NR, Caricchio R, Baba Y, Zhou Y, Kaufman BA, Cheung JY, Kurosaki T, Gill DL, Madesh M. Shanmughapriya S, et al. Sci Signal. 2015 Mar 3;8(366):ra23. doi: 10.1126/scisignal.2005673. Sci Signal. 2015. PMID: 25737585 Free PMC article.
References
- Berridge MJ, Lipp P, Bootman MD. The versatility and universality of calcium signalling. Nat Rev Mol Cell Biol. 2000;1:11–21. - PubMed
- Bidere N, Su HC, Lenardo MJ. Genetic disorders of programmed cell death in the immune system. Annu Rev Immunol. 2006;24:321–352. - PubMed
- Chaudhri G, Clark IA, Hunt NH, Cowden WB, Ceredig R. Effect of antioxidants on primary alloantigen-induced T cell activation and proliferation. J Immunol. 1986;137:2646–2652. - PubMed
Publication types
MeSH terms
Substances
Grants and funding
- BBS/E/B/0000H110/BB_/Biotechnology and Biological Sciences Research Council/United Kingdom
- BBS/E/B/00001116/BB_/Biotechnology and Biological Sciences Research Council/United Kingdom
- R01 CA099179/CA/NCI NIH HHS/United States
- BBS/E/B/0000C116/BB_/Biotechnology and Biological Sciences Research Council/United Kingdom
- R01 GM056328/GM/NIGMS NIH HHS/United States
- R01 CA099179-06/CA/NCI NIH HHS/United States
LinkOut - more resources
Full Text Sources
Other Literature Sources
Molecular Biology Databases
Research Materials
Miscellaneous


