Parallels between global transcriptional programs of polarizing Caco-2 intestinal epithelial cells in vitro and gene expression programs in normal colon and colon cancer - PubMed (original) (raw)
Parallels between global transcriptional programs of polarizing Caco-2 intestinal epithelial cells in vitro and gene expression programs in normal colon and colon cancer
Annika M Sääf et al. Mol Biol Cell. 2007 Nov.
Abstract
Posttranslational mechanisms are implicated in the development of epithelial cell polarity, but little is known about the patterns of gene expression and transcriptional regulation during this process. We characterized temporal patterns of gene expression during cell-cell adhesion-initiated polarization of cultured human Caco-2 cells, which develop structural and functional polarity resembling enterocytes in vivo. A distinctive switch in gene expression patterns occurred upon formation of cell-cell contacts. Comparison to gene expression patterns in normal human colon and colon tumors revealed that the pattern in proliferating, nonpolarized Caco-2 cells paralleled patterns seen in human colon cancer in vivo, including expression of genes involved in cell proliferation. The pattern switched in polarized Caco-2 cells to one more closely resembling that in normal colon tissue, indicating that regulation of transcription underlying Caco-2 cell polarization is similar to that during enterocyte differentiation in vivo. Surprisingly, the temporal program of gene expression in polarizing Caco-2 cells involved changes in signaling pathways (e.g., Wnt, Hh, BMP, FGF) in patterns similar to those during migration and differentiation of intestinal epithelial cells in vivo, despite the absence of morphogen gradients and interactions with stromal cells characteristic of enterocyte differentiation in situ. The full data set is available at http://microarray-pubs.stanford.edu/CACO2.
Figures
Figure 1.
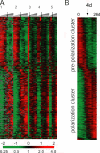
Hierarchical cluster analysis of Caco-2 cell polarization in vitro. (A) Thumbnail overview of 513 genes, whose expression varies in at least three samples by a factor of at least three from the mean across all samples, illustrating the temporally staged transcriptional reprogramming during establishment of polarity in Caco-2 cells. Genes (rows) are organized by hierarchical clustering based on overall similarity in expression pattern, and samples (columns) are in temporal order from left to right. Expression levels of each gene relative to its mean expression level over the time course are displayed in a log2 scale. Relative expression levels above or below the mean over the time course are indicated by red or green, respectively. Five replicate time-course experiments are shown. Arrows indicate the 4-d time point in each individual time course. (B) Transcript levels of each of the 513 genes were averaged across the five replicate time-course experiments and sorted by the time at which a major increase in expression occurred, as described in work by DeRisi and coworkers (Bozdech et al., 2003). The abrupt transition in gene expression profiles at the 4-d time point is indicated with an arrow.
Figure 2.
Comparison between gene expression patterns underlying establishment of Caco-2 cell polarity in vitro to the gene expression signature identified in healthy human colon tissue and colon cancer. (A) Approximately 4000 array elements selected for differential expression by two-class significance analysis of microarrays (SAM) analysis were used to extract patterns of gene expression from normal human colon tissue and colon tumor data sets. Hierarchical cluster analysis of polarizing Caco-2 cells and the healthy colon and colon cancer data sets together clearly separates the samples (columns) into two branches, and genes (rows) into two distinct clusters, demonstrating that Caco-2 cells undergo a transcriptional transition from a gene expression program paralleling that of colon tumor samples (0–2 d in culture; right branch) to a program very similar to that observed in normal human colon tissue (4–26 d in culture; left branch). (B) High-resolution view of genes representing the “normal epithelial cluster” (cluster A–F) and the “tumor cluster” (cluster G–M). Overall, our analysis reveals remarkably similarities in the expression profiles of proliferating Caco-2 cells and colon tumor cells and in postmitotic, polarized Caco-2 cells and normal colon cells. However, some exceptions, which are illustrated in cluster N, were identified. Transcript levels determined by microarray analysis are shown relative to a reference pool of human mRNAs.
Figure 3.
(A) Genes characteristically expressed during cell proliferation show a distinct temporal expression pattern during development of Caco-2 cell polarity in vitro. A set of 112 proliferation-related genes previously identified by Perou et al. (2000) in breast cancer samples are coordinately decreased in expression at the 4-d time point (marked with red arrow) in Caco-2 cells. A full list of cell cycle–regulated genes and their expression in polarizing Caco-2 cells and phase assignments can be viewed in Supplementary Figure S1. (B) Comparison of the coexpression of 927 cell cycle genes classified by their cyclic mitotic expression between differentiating Caco-2 cells and normal and colon human tissue. A set of cell cycle genes previously identified as “periodically expressed during human cell cycle” (Whitfield et al., 2002) was used to extract patterns of gene expression from the Caco-2 time course, normal and cancerous human colon. Hierarchical cluster analysis, in the gene and experiment dimension, of cell cycle genes expressed during in vitro epithelial cell polarization and human colon tissue (left) revealed the presence of two distinct gene clusters: the first representing early Caco-2 time points and colon tumor samples and the second representing late Caco-2 time points and normal colon tissue, also illustrated in the high-resolution inset (right). Transcript levels determined by microarray analysis are shown relative to a reference pool of human mRNAs.
Figure 4.
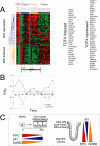
Global changes in expression of Wnt target genes during Caco-2 cell polarization in vitro. (A) A set of genes previously identified as regulated by TCF4 in colorectal cancer (CRC; A, left; van de Wetering et al., 2002) was used to extract patterns of gene expression from polarizing Caco-2 cells (A, middle), and normal human colon and colon tumor data sets (A, right). A reciprocal pattern was found for TCF4-induced and TCF4-repressed genes during early and late stages of in vitro epithelial polarization paralleling the trends between colon tumors and normal colon. The genes comprising each list are shown on the far right. (B) The similarity of expression patterns of TCF4 target genes between Caco-2 cells in vitro and enterocytes differentiating along the crypt-villus axis in vivo is illustrated by the expression of EphB2 and Ephrin-B1. EphB2 expression was highest in proliferating Caco-2 cells, whereas Ephrin-B1 transcripts increased as the cells polarized (B, left). (C) Overall expression of TCF4 induced or repressed genes during Caco-2 cell polarization in vitro mimics gene profiles in normal human colon where a progressively diminishing Wnt activity gradient occurs along the crypt-villus axis. Y-axis indicates fold change of transcript levels relative to a reference pool of human mRNAs on a log2 scale.
Figure 5.
Subcellular distribution of β-catenin during Caco-2 cell polarization. (A) Simplified schematic of classical Wnt signaling. Wnt signaling through Frizzled receptors inhibits destruction of the transcription cofactor β-catenin by the APC/Axin/GSK3β complex, leading to β-catenin stabilization, nuclear translocation, and complex formation with the TCF/LEF family of transcriptional cofactors that activate Wnt target genes. (B) Levels of β-catenin were compared in membrane, cytoplasmic, and nuclear fractions in nonpolarized (1d) and polarized (21d) Caco-2 cells as both raw band intensity (top graph) and percentage of the entire β-catenin pool (bottom graph). Nuclear β-catenin increased more than eightfold in polarized cells, compared with nonpolarized cells. This is consistent with the absence of a functional APC destruction complex in Caco-2 cells, leading to accumulation of nuclear β-catenin. n = 3. Error bars, SE.
Figure 6.
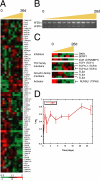
Gene-expression patterns of Wnt pathway components during Caco-2 cell polarization in vitro. (A) Transcriptional levels of components of the Wnt pathway including the β-catenin destruction complex changed over time, although not as a cohort. (B) Isoform-specific RT-PCR showed that full-length FZD4 (flFZD4) mRNA increased during polarization, whereas that of the soluble form (sFZD4) had a more modest transcriptional regulation. (C) Proteins with an inhibitory effect on Wnt signaling, including DKK1, SFRP, and ICAT, or activators of the pathway such as TCF isoforms and RUVBL1 (TIP49), were temporally regulated during Caco-2 cell polarization. Members of the Groucho (TLE) family of Wnt suppressors were expressed from the beginning to the middle of the time course. (D) Expression of HBP1, which inhibits activation of Wnt target genes by preventing the interaction of the β-catenin-TCF4 complex with DNA, increased during Caco-2 cell polarization. Y-axis indicates fold change of transcript levels relative to a reference pool of human mRNAs on a log2 scale. Error bars, SE.
Figure 7.
Regulation of the noncanonical Wnt pathway. (A) Schematic of noncanonical Wnt pathway proteins and their possible effect on canonical Wnt signaling. (B) Transcriptional levels of noncanonical Wnt pathway components increased during Caco-2 cell polarization in vitro. Transcript levels determined by microarray analysis are shown relative to a reference pool of human mRNAs.
Figure 8.
Components of signaling pathways involved in intestinal epithelium formation in vivo are regulated during Caco-2 cell polarization in vitro. (A) Proteins in the Notch, Hedgehog. BMP, FGF, and EGF pathways were temporally expressed during Caco-2 cell polarization. A reciprocal expression pattern was identified for FGF receptors and FGF antagonists Sprouty1 and Sprouty 2. (B) Members of the BMP family (BMP2 and BMP7) showed an inverse expression pattern in polarizing Caco-2 cells, and a similar trend was identified in normal and colon cancer tissue. BMP2 expression was similar in polarized Caco-2 cells and healthy colon tissue, whereas BMP7 was more highly expressed in proliferating Caco-2 cells and cancerous colon tissue. Y-axis indicates fold change of transcript levels relative to a reference pool of human mRNAs on a Log2 scale. (C) Expression patterns of EGF and EGFR were confirmed by RT-PCR.
Similar articles
- Transcriptional modulation of genes encoding structural characteristics of differentiating enterocytes during development of a polarized epithelium in vitro.
Halbleib JM, Sääf AM, Brown PO, Nelson WJ. Halbleib JM, et al. Mol Biol Cell. 2007 Nov;18(11):4261-78. doi: 10.1091/mbc.e07-04-0308. Epub 2007 Aug 15. Mol Biol Cell. 2007. PMID: 17699590 Free PMC article. - Gene expression patterns of human colon tops and basal crypts and BMP antagonists as intestinal stem cell niche factors.
Kosinski C, Li VS, Chan AS, Zhang J, Ho C, Tsui WY, Chan TL, Mifflin RC, Powell DW, Yuen ST, Leung SY, Chen X. Kosinski C, et al. Proc Natl Acad Sci U S A. 2007 Sep 25;104(39):15418-23. doi: 10.1073/pnas.0707210104. Epub 2007 Sep 19. Proc Natl Acad Sci U S A. 2007. PMID: 17881565 Free PMC article. - Down-regulation of beta-catenin TCF signaling is linked to colonic epithelial cell differentiation.
Mariadason JM, Bordonaro M, Aslam F, Shi L, Kuraguchi M, Velcich A, Augenlicht LH. Mariadason JM, et al. Cancer Res. 2001 Apr 15;61(8):3465-71. Cancer Res. 2001. PMID: 11309309 - Pathogenesis of human enterovirulent bacteria: lessons from cultured, fully differentiated human colon cancer cell lines.
Liévin-Le Moal V, Servin AL. Liévin-Le Moal V, et al. Microbiol Mol Biol Rev. 2013 Sep;77(3):380-439. doi: 10.1128/MMBR.00064-12. Microbiol Mol Biol Rev. 2013. PMID: 24006470 Free PMC article. Review. - Changes in cell and tissue organization in cancer of the breast and colon.
Hinck L, Näthke I. Hinck L, et al. Curr Opin Cell Biol. 2014 Feb;26:87-95. doi: 10.1016/j.ceb.2013.11.003. Epub 2013 Dec 5. Curr Opin Cell Biol. 2014. PMID: 24529250 Free PMC article. Review.
Cited by
- Differential gene expression between African American and European American colorectal cancer patients.
Jovov B, Araujo-Perez F, Sigel CS, Stratford JK, McCoy AN, Yeh JJ, Keku T. Jovov B, et al. PLoS One. 2012;7(1):e30168. doi: 10.1371/journal.pone.0030168. Epub 2012 Jan 19. PLoS One. 2012. PMID: 22276153 Free PMC article. - The insulin receptor substrate 1 (IRS1) in intestinal epithelial differentiation and in colorectal cancer.
Esposito DL, Aru F, Lattanzio R, Morgano A, Abbondanza M, Malekzadeh R, Bishehsari F, Valanzano R, Russo A, Piantelli M, Moschetta A, Lotti LV, Mariani-Costantini R. Esposito DL, et al. PLoS One. 2012;7(4):e36190. doi: 10.1371/journal.pone.0036190. Epub 2012 Apr 27. PLoS One. 2012. PMID: 22558377 Free PMC article. - Colitis-associated colorectal cancer driven by T-bet deficiency in dendritic cells.
Garrett WS, Punit S, Gallini CA, Michaud M, Zhang D, Sigrist KS, Lord GM, Glickman JN, Glimcher LH. Garrett WS, et al. Cancer Cell. 2009 Sep 8;16(3):208-19. doi: 10.1016/j.ccr.2009.07.015. Cancer Cell. 2009. PMID: 19732721 Free PMC article. - PLEKHA7 is an adherens junction protein with a tissue distribution and subcellular localization distinct from ZO-1 and E-cadherin.
Pulimeno P, Bauer C, Stutz J, Citi S. Pulimeno P, et al. PLoS One. 2010 Aug 20;5(8):e12207. doi: 10.1371/journal.pone.0012207. PLoS One. 2010. PMID: 20808826 Free PMC article. - Human cytomegalovirus infection enhances 5‑lipoxygenase and cycloxygenase‑2 expression in colorectal cancer.
Pantalone MR, Martin Almazan N, Lattanzio R, Taher C, De Fabritiis S, Valentinuzzi S, Bishehsari F, Mahdavinia M, Verginelli F, Rahbar A, Mariani-Costantini R, Söderberg-Naucler C. Pantalone MR, et al. Int J Oncol. 2023 Nov;63(5):116. doi: 10.3892/ijo.2023.5564. Epub 2023 Sep 1. Int J Oncol. 2023. PMID: 37654195 Free PMC article.
References
- Abercrombie M. Contact inhibition in tissue culture. In Vitro. 1970;6:128–142. - PubMed
- Almasan A., Ashkenazi A. Apo2L/TRAIL: apoptosis signaling, biology, and potential for cancer therapy. Cytokine Growth Factor Rev. 2003;14:337–348. - PubMed
Publication types
MeSH terms
Substances
Grants and funding
- R01 CA077097/CA/NCI NIH HHS/United States
- GM35527/GM/NIGMS NIH HHS/United States
- R01 GM035527/GM/NIGMS NIH HHS/United States
- R37 GM035527/GM/NIGMS NIH HHS/United States
- CA77097/CA/NCI NIH HHS/United States
LinkOut - more resources
Full Text Sources
Other Literature Sources
Molecular Biology Databases


