Human C-reactive protein slows atherosclerosis development in a mouse model with human-like hypercholesterolemia - PubMed (original) (raw)
Human C-reactive protein slows atherosclerosis development in a mouse model with human-like hypercholesterolemia
Alexander Kovacs et al. Proc Natl Acad Sci U S A. 2007.
Abstract
Increased baseline values of the acute-phase reactant C-reactive protein (CRP) are significantly associated with future cardiovascular disease, and some in vitro studies have claimed that human CRP (hCRP) has proatherogenic effects. in vivo studies in apolipoprotein E-deficient mouse models, however, have given conflicting results. We bred atherosclerosis-prone mice (Apob(100/100)Ldlr(-/-)), which have human-like hypercholesterolemia, with hCRP transgenic mice (hCRP(+/0)) and studied lesion development at 15, 30, 40, and 50 weeks of age. Atherosclerotic lesions were smaller in hCRP(+/0)Apob(100/100)Ldlr(-/-) mice than in hCRP(0/0)Apob(100/100)Ldlr(-/-) controls, as judged from the lesion surface areas of pinned-out aortas from mice at 40 and 50 weeks of age. In lesions from 40-week-old mice, mRNA expression levels of several genes in the proteasome degradation pathway were higher in hCRP(+/0)Apob(100/100)Ldlr(-/-) mice than in littermate controls, as shown by global gene expression profiles. These results were confirmed by real-time PCR, which also indicated that the activities of those genes were the same at 30 and 40 weeks in hCRP(+/0)Apob(100/100)Ldlr(-/-) mice but were significantly lower at 40 weeks than at 30 weeks in controls. Our results show that hCRP is not proatherogenic but instead slows atherogenesis, possibly through proteasome-mediated protein degradation.
Conflict of interest statement
The authors declare no conflict of interest.
Figures
Fig. 1.
Atherosclerosis development in _LDlr_−/−_Apob_100/100 mice with and without hCRP expression. (A) Sudan IV-stained atherosclerotic lesions in pinned-out aortas (Upper) and aortic arches of the same aortas (Lower) from representative mice in both groups. (B) Lesion surface area is reported as the area of Sudan IV staining, expressed as percentage of the entire surface area of the aorta from the iliac bifurcation to the aortic root. n = 17 CRP+/0_Ldlr_−/−_Apob_100/100 mice (filled bars) and 19 controls (open bars) at 30 weeks; n = 13 and 10 at 40 weeks; n = 11 and 15 at 50 weeks. Values are mean ± SD. †, P = 0.027 (40 weeks); *, P = 0.041 (50 weeks) vs. control mice. N.D., not detectable.
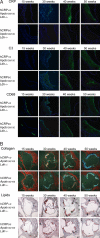
Fig. 2.
Atherosclerosis histology of _Ldlr_−/−_Apob_100/100 mice with and without hCRP expression. (A) Immunofluorescence staining for CRP, C3, and CD68 in aortic root sections from CRP+/0_Ldlr_−/−_Apob_100/100 mice and _CRP_0/0_Ldlr_−/−_Apob_100/100 controls. Sections were incubated with primary antibodies and then with fluorescently labeled anti-rat IgG and counterstained with DAPI. (B) Aortic root sections stained with Masson's trichrome (collagen) and Oil Red O (lipids) from representative mice in both groups. Except for focal C3 staining in controls at 40 and 50 weeks and ≈10% more collagen in lesions of CRP+/0_Ldlr_−/−_Apob_100/100 at 50 weeks (n = 5 + 5; P < 0.05), there were no other differences between groups.
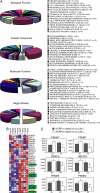
Fig. 3.
Global gene expression analysis and real-time PCR of mRNA isolated from the arterial wall in the aortic arch, including the atherosclerotic lesions (see Materials and Methods) of mice at 30 and 40 weeks of age. (A) Pie charts of Gene Ontology categories (biological processes, molecular functions, and cellular component) and Kegg pathways generated from 742 differentially expressed genes (LFDR < 0.25;
SI Table 2
). The P values next to each category were calculated with Fisher's exact probability test (
SI Appendix 1
). (B) Heat map showing mRNA levels (blue, low; red, high) of genes (rows) in the proteasome degradation pathway, which was highly active in the CRP+/0_Ldlr_−/−_Apob_100/100 mice compared with the controls (LFDR < 0.09), as shown by gene set enrichment analysis of the same GeneChips. Gene names marked in green were chosen for real-time PCR analysis. (C) mRNA levels of six genes central to proteasome degradation (PSMA7, PSMB7, PSMB9, PSMC6, PSME2, and UBE2D3) determined by real-time PCR of total RNA from aortic arch lesions in CRP+/0_Ldlr_−/−_Apob_100/100 mice (filled bars) and _CRP_−/−_Ldlr_−/−_Apob_100/100 controls (open bars) at 30 weeks (n = 5 and n = 7, respectively) and 40 weeks (n = 8 per group). Values are mean ± SD. *, P < 0.02; †, P < 0.006; ‡, P < 0.02; §, P < 0.05; ‖, P < 0.006; #, P < 0.004 vs. controls at 30 weeks.
Similar articles
- No effect of C-reactive protein on early atherosclerosis in LDLR-/- / human C-reactive protein transgenic mice.
Torzewski M, Reifenberg K, Cheng F, Wiese E, Küpper I, Crain J, Lackner KJ, Bhakdi S. Torzewski M, et al. Thromb Haemost. 2008 Jan;99(1):196-201. doi: 10.1160/TH07-10-0595. Thromb Haemost. 2008. PMID: 18217154 - Increased atherosclerotic lesion calcification in a novel mouse model combining insulin resistance, hyperglycemia, and hypercholesterolemia.
Heinonen SE, Leppänen P, Kholová I, Lumivuori H, Häkkinen SK, Bosch F, Laakso M, Ylä-Herttuala S. Heinonen SE, et al. Circ Res. 2007 Nov 9;101(10):1058-67. doi: 10.1161/CIRCRESAHA.107.154401. Epub 2007 Sep 13. Circ Res. 2007. PMID: 17872464 - No effect of C-reactive protein on early atherosclerosis development in apolipoprotein E*3-leiden/human C-reactive protein transgenic mice.
Trion A, de Maat MP, Jukema JW, van der Laarse A, Maas MC, Offerman EH, Havekes LM, Szalai AJ, Princen HM, Emeis JJ. Trion A, et al. Arterioscler Thromb Vasc Biol. 2005 Aug;25(8):1635-40. doi: 10.1161/01.ATV.0000171992.36710.1e. Epub 2005 May 26. Arterioscler Thromb Vasc Biol. 2005. PMID: 15920036 - Is it just paraoxonase 1 or are other members of the paraoxonase gene family implicated in atherosclerosis?
Reddy ST, Devarajan A, Bourquard N, Shih D, Fogelman AM. Reddy ST, et al. Curr Opin Lipidol. 2008 Aug;19(4):405-8. doi: 10.1097/MOL.0b013e328304b64e. Curr Opin Lipidol. 2008. PMID: 18607188 Review. - Cellular and molecular mechanisms of atherosclerosis with mouse models.
Ohashi R, Mu H, Yao Q, Chen C. Ohashi R, et al. Trends Cardiovasc Med. 2004 Jul;14(5):187-90. doi: 10.1016/j.tcm.2004.04.002. Trends Cardiovasc Med. 2004. PMID: 15261890 Review.
Cited by
- Emerging biomarkers for evaluating cardiovascular risk in the chronic kidney disease patient: how do new pieces fit into the uremic puzzle?
Stenvinkel P, Carrero JJ, Axelsson J, Lindholm B, Heimbürger O, Massy Z. Stenvinkel P, et al. Clin J Am Soc Nephrol. 2008 Mar;3(2):505-21. doi: 10.2215/CJN.03670807. Epub 2008 Jan 9. Clin J Am Soc Nephrol. 2008. PMID: 18184879 Free PMC article. Review. - Recognition functions of pentameric C-reactive protein in cardiovascular disease.
Agrawal A, Gang TB, Rusiñol AE. Agrawal A, et al. Mediators Inflamm. 2014;2014:319215. doi: 10.1155/2014/319215. Epub 2014 May 19. Mediators Inflamm. 2014. PMID: 24948846 Free PMC article. Review. - Mutations of C-reactive protein (CRP) -286 SNP, APC and p53 in colorectal cancer: implication for a CRP-Wnt crosstalk.
Su HX, Zhou HH, Wang MY, Cheng J, Zhang SC, Hui F, Chen XZ, Liu SH, Liu QJ, Zhu ZJ, Hu QR, Wu Y, Ji SR. Su HX, et al. PLoS One. 2014 Jul 15;9(7):e102418. doi: 10.1371/journal.pone.0102418. eCollection 2014. PLoS One. 2014. PMID: 25025473 Free PMC article. - Assessing the role of circulating, genetic, and imaging biomarkers in cardiovascular risk prediction.
Wang TJ. Wang TJ. Circulation. 2011 Feb 8;123(5):551-65. doi: 10.1161/CIRCULATIONAHA.109.912568. Circulation. 2011. PMID: 21300963 Free PMC article. Review. No abstract available. - C-reactive protein and cardiovascular disease: From animal studies to the clinic (Review).
Fu Y, Wu Y, Liu E. Fu Y, et al. Exp Ther Med. 2020 Aug;20(2):1211-1219. doi: 10.3892/etm.2020.8840. Epub 2020 Jun 4. Exp Ther Med. 2020. PMID: 32765664 Free PMC article. Review.
References
- Danesh J, Wheeler JG, Hirschfield GM, Eda S, Eiriksdottir G, Rumley A, Lowe GD, Pepys MB, Gudnason V. N Engl J Med. 2004;350:1387–1397. - PubMed
- Ridker PM, Wilson PWF, Grundy SM. Circulation. 2004;109:2818–2825. - PubMed
- Jialal I, Devaraj S, Venugopal SK. Hypertension. 2004;44:6–11. - PubMed
- Plump AS, Smith JD, Hayek T, Aalto-Setala K, Walsh A, Verstuyft JG, Rubin EM, Breslow JL. Cell. 1992;71:343–353. - PubMed
Publication types
MeSH terms
Substances
LinkOut - more resources
Full Text Sources
Medical
Molecular Biology Databases
Research Materials
Miscellaneous


