Naive CD4(+) T cell frequency varies for different epitopes and predicts repertoire diversity and response magnitude - PubMed (original) (raw)
Naive CD4(+) T cell frequency varies for different epitopes and predicts repertoire diversity and response magnitude
James J Moon et al. Immunity. 2007 Aug.
Abstract
Cell-mediated immunity stems from the proliferation of naive T lymphocytes expressing T cell antigen receptors (TCRs) specific for foreign peptides bound to host major histocompatibility complex (MHC) molecules. Because of the tremendous diversity of the T cell repertoire, naive T cells specific for any one peptide:MHC complex (pMHC) are extremely rare. Thus, it is not known how many naive T cells of any given pMHC specificity exist in the body or how that number influences the immune response. By using soluble pMHC class II (pMHCII) tetramers and magnetic bead enrichment, we found that three different pMHCII-specific naive CD4(+) T cell populations vary in frequency from 20 to 200 cells per mouse. Moreover, naive population size predicted the size and TCR diversity of the primary CD4(+) T cell response after immunization with relevant peptide. Thus, variation in naive T cell frequencies can explain why some peptides are stronger immunogens than others.
Figures
Figure 1. Primary immune responses of naive CD4+ T cells vary with respect to pMHC specificity
A, Flow cytometry gates used in all figures to identify T cells from total spleen and lymph node cells: side scatter-widthlow (left plot); CD3+, non-T cell lineage- (middle plot); and either CD4+ or CD8+ (right plot). B, Where indicated, B6 mice were injected i.v. with 50 µg of the indicated peptide plus 5 µg LPS. Eight days later, spleen and lymph node cells were harvested and stained with the indicated tetramer. Representative contour plots of CD44 versus the indicated tetramers are shown for non-T cell lineage-, CD3+, CD4+ events gated from 106 total collected events. The total number of cells for each individual mouse shown is indicated below the relevant gate. Mean values ± S.D. were 2W1S:115,000 ± 40,000; FliC: 23,000 ± 20,000; OVA: 7,000 ± 3,000 (n=4 per group).
Figure 2. Tetramer-based enrichment increases the sensitivity of detection of epitope-specific T cell populations
Representative contour plots of CD90.1 versus FliC:I-Ab for CD4+ gated events from mixtures of 2.5 × 10⁸ B6 spleen and lymph node cells and the indicated numbers of SM1 TCR transgenic T cells analyzed directly (top row) or after tetramer-based enrichment (bottom row). SM1 cells are shown in the upper gate and polyclonal FliC:I-Ab-specific CD4+ T cells in the lower gate. Data is representative of two independent experiments.
Figure 3. Naïve pMHCII-specific CD4+ T cells can be detected using tetramer-based enrichment
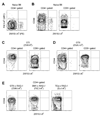
A, Representative contour plot of FliC:I-Ab tetramer (APC) versus 2W1S:I-Ab tetramer (PE) for non-T cell lineage-, CD3+, CD4+ events in a spleen and lymph node cell population from a naive B6 mouse after enrichment with FliC:I-Ab and 2W1S:I-Ab tetramers. B, Representative contour plots of CD44 versus 2W1S:I-Ab for CD4+ or CD8+ gated events following 2W1S:I-Ab tetramer enrichment of total spleen and lymph node cells from a naive B6 mouse, or C, an OT-I RAG1−/−, or D, an OT-II RAG1+/+ TCR transgenic mouse. E, Representative contour plots of CD44 versus 2W1S:I-Ab for CD4+ gated events following 2W1S:I-Ab tetramer enrichment of total spleen and lymph node cells from OT-II RAG1−/−, SM1 RAG1−/−, and TEa RAG1−/− TCR transgenic mice. Data is representative of at least 3 independent experiments.
Figure 4. Tetramer-binding T cells are responsive to their relevant peptide
A, 2W1S:I-Ab enrichment was performed on total spleen and lymph node cells from B6 mice injected i.v. 48 hours earlier with 5 µg LPS (left panels), or 5 µg LPS plus 250 µg 2W1S peptide (right panels). CD4+, 2W1S:I-Ab+ events were then analyzed for CD44 expression and blastogenesis (forward scatter). Numbers indicate percentages of events in each quadrant. Data is representative of at least 3 independent experiments. B, Contour plots of CD44 versus tetramer for 2W1S:I-Ab or FliC:I-Ab enriched spleen and lymph node cells from B6 RAG1−/− hosts that received either 2W1S:I-Ab or FliC:I-Ab tetramer-depleted cells from naïve B6 mice, and were then injected i.v. with a mixture of 50 µg 2W1S peptide, 50 µg FliC peptide, and 5 µg LPS 8 days before analysis. The total number of tetramer+ cells for each population is shown below the relevant gate. Data shown is representative of three independent experiments.
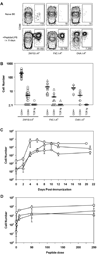
Figure 5. Naive CD4+ T cell populations vary in size
A, Representative contour plots of CD44 versus tetramer for CD4+ events from total spleen and lymph node cells from naive B6 mice (top row) or B6 mice injected i.v. with 50 µg of the indicated peptide plus 5 µg LPS (bottom row) following enrichment with the indicated tetramers. B, Total numbers of tetramer+, CD4+ or CD8+ cells following tetramer enrichment of total spleen and lymph node cells from a naive B6 mouse or tetramer+, CD4+ cells from OT-II RAG1−/−, TEa RAG1−/−, or SM1 RAG1−/− TCR transgenic mice. Symbols represent individual mice; horizontal bars indicate mean values. C, Mean total number (±S.D., n=2–8) of 2W1S:I-Ab+ (circles), FliC:I-Ab+ (triangles), or OVA:I-Ab+ (diamonds) cells in B6 mice over time following i.v. injection with 50 µg of the relevant peptide plus 5 µg LPS. D, Mean total number (±S.D., n=3) of 2W1S:I-Ab+ (circles), FliC:I-Ab+ (triangles), or OVA:I-Ab+ (diamonds) cells in B6 mice 4 days following i.v. injection with 5 µg LPS plus the indicated amount of relevant peptide.
Figure 6. Naive CD4+ T cell population diversity is related to population size
A, Total lymph node and spleen cells from naive B6 mice (top) or B6 mice injected i.v. with 50 µg 2W1S peptide plus 5 µg LPS 4 days earlier (bottom) were stained with antibodies to TCR Vβ4 and Vα2. 2W1S:I-Ab- and 2W1S:I-Ab+ gated events are represented in histograms by shaded profiles and solid lines, respectively. B, TCR Vβ and Vα gene segment usage in total CD4+ T cells from naive mice (unfilled bars), or 2W1S:I-Ab+ CD4+ T cells from naive mice (filled bars) or mice injected i.v. with 50 µg 2W1S peptide plus 5 µg LPS 4 days earlier (hatched bars). Data are mean values ± S.D. from 4∓8 mice per group. C, Usage profile for TCR Vβ gene segments in total CD4+ T cells from naive B6 mice or tetramer+ CD4+ T cells from B6 mice injected i.v. with 50 µg of the indicated peptide plus 5 µg LPS 8 days earlier. Data are values from pooled samples taken from 4–10 mice per group, or D, samples taken from 4 individual mice per group.
Comment in
- The alphabeta T cell repertoire comes into focus.
Davis MM. Davis MM. Immunity. 2007 Aug;27(2):179-80. doi: 10.1016/j.immuni.2007.08.005. Immunity. 2007. PMID: 17723209
Similar articles
- Negative selection and peptide chemistry determine the size of naive foreign peptide-MHC class II-specific CD4+ T cell populations.
Chu HH, Moon JJ, Kruse AC, Pepper M, Jenkins MK. Chu HH, et al. J Immunol. 2010 Oct 15;185(8):4705-13. doi: 10.4049/jimmunol.1002276. Epub 2010 Sep 22. J Immunol. 2010. PMID: 20861357 Free PMC article. - The Neonatal CD4+ T Cell Response to a Single Epitope Varies in Genetically Identical Mice.
Nelson RW, Rajpal MN, Jenkins MK. Nelson RW, et al. J Immunol. 2015 Sep 1;195(5):2115-21. doi: 10.4049/jimmunol.1500405. Epub 2015 Jul 15. J Immunol. 2015. PMID: 26179899 Free PMC article. - Force-Regulated In Situ TCR-Peptide-Bound MHC Class II Kinetics Determine Functions of CD4+ T Cells.
Hong J, Persaud SP, Horvath S, Allen PM, Evavold BD, Zhu C. Hong J, et al. J Immunol. 2015 Oct 15;195(8):3557-64. doi: 10.4049/jimmunol.1501407. Epub 2015 Sep 2. J Immunol. 2015. PMID: 26336148 Free PMC article. - Regulation of CD4 T-cell receptor diversity by vaccine adjuvants.
Baumgartner CK, Malherbe LP. Baumgartner CK, et al. Immunology. 2010 May;130(1):16-22. doi: 10.1111/j.1365-2567.2010.03265.x. Epub 2010 Mar 17. Immunology. 2010. PMID: 20331477 Free PMC article. Review. - Endogenous peptides associated with MHC class II and selection of CD4 T cells.
Rudensky AY. Rudensky AY. Semin Immunol. 1995 Dec;7(6):399-409. doi: 10.1006/smim.1995.0044. Semin Immunol. 1995. PMID: 8775465 Review.
Cited by
- T-cell-mediated immunity and the role of TRAIL in sepsis-induced immunosuppression.
Condotta SA, Cabrera-Perez J, Badovinac VP, Griffith TS. Condotta SA, et al. Crit Rev Immunol. 2013;33(1):23-40. doi: 10.1615/critrevimmunol.2013006721. Crit Rev Immunol. 2013. PMID: 23510024 Free PMC article. Review. - Innate memory T cells.
Jameson SC, Lee YJ, Hogquist KA. Jameson SC, et al. Adv Immunol. 2015;126:173-213. doi: 10.1016/bs.ai.2014.12.001. Epub 2015 Feb 7. Adv Immunol. 2015. PMID: 25727290 Free PMC article. Review. - Molecular basis for universal HLA-A*0201-restricted CD8+ T-cell immunity against influenza viruses.
Valkenburg SA, Josephs TM, Clemens EB, Grant EJ, Nguyen TH, Wang GC, Price DA, Miller A, Tong SY, Thomas PG, Doherty PC, Rossjohn J, Gras S, Kedzierska K. Valkenburg SA, et al. Proc Natl Acad Sci U S A. 2016 Apr 19;113(16):4440-5. doi: 10.1073/pnas.1603106113. Epub 2016 Mar 31. Proc Natl Acad Sci U S A. 2016. PMID: 27036003 Free PMC article. Clinical Trial. - T Cell Adaptive Immunity Proceeds through Environment-Induced Adaptation from the Exposure of Cryptic Genetic Variation.
Whitacre JM, Lin J, Harding A. Whitacre JM, et al. Front Genet. 2012 Feb 9;3:5. doi: 10.3389/fgene.2012.00005. eCollection 2012. Front Genet. 2012. PMID: 22363338 Free PMC article. - Defective CD8 T cell responses in aged mice are due to quantitative and qualitative changes in virus-specific precursors.
Decman V, Laidlaw BJ, Doering TA, Leng J, Ertl HC, Goldstein DR, Wherry EJ. Decman V, et al. J Immunol. 2012 Feb 15;188(4):1933-41. doi: 10.4049/jimmunol.1101098. Epub 2012 Jan 13. J Immunol. 2012. PMID: 22246631 Free PMC article.
References
- Barnden MJ, Allison J, Heath WR, Carbone FR. Defective TCR expression in transgenic mice constructed using cDNA-based alpha- and beta-chain genes under the control of heterologous regulatory elements. Immunol Cell Biol. 1998;76:34–40. - PubMed
- Boursalian TE, Golob J, Soper DM, Cooper CJ, Fink PJ. Continued maturation of thymic emigrants in the periphery. Nat Immunol. 2004;5:418–425. - PubMed
Publication types
MeSH terms
Substances
LinkOut - more resources
Full Text Sources
Other Literature Sources
Research Materials


