Quantitative characteristics of gene regulation by small RNA - PubMed (original) (raw)
Quantitative characteristics of gene regulation by small RNA
Erel Levine et al. PLoS Biol. 2007 Sep.
Erratum in
- PLoS Biol. 2008 Jan;6(1):e5
Abstract
An increasing number of small RNAs (sRNAs) have been shown to regulate critical pathways in prokaryotes and eukaryotes. In bacteria, regulation by trans-encoded sRNAs is predominantly found in the coordination of intricate stress responses. The mechanisms by which sRNAs modulate expression of its targets are diverse. In common to most is the possibility that interference with the translation of mRNA targets may also alter the abundance of functional sRNAs. Aiming to understand the unique role played by sRNAs in gene regulation, we studied examples from two distinct classes of bacterial sRNAs in Escherichia coli using a quantitative approach combining experiment and theory. Our results demonstrate that sRNA provides a novel mode of gene regulation, with characteristics distinct from those of protein-mediated gene regulation. These include a threshold-linear response with a tunable threshold, a robust noise resistance characteristic, and a built-in capability for hierarchical cross-talk. Knowledge of these special features of sRNA-mediated regulation may be crucial toward understanding the subtle functions that sRNAs can play in coordinating various stress-relief pathways. Our results may also help guide the design of synthetic genetic circuits that have properties difficult to attain with protein regulators alone.
Conflict of interest statement
Competing interests. The authors have declared that no competing interests exist.
Figures
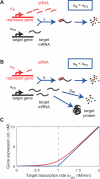
Figure 1. Threshold-Linear Response of a Target Gene
(A) and (B) depict an idealized model for the interaction between mRNAs of a target gene and sRNAs. If the sRNA transcription rate is larger than that of the target (A), then gene expression is silenced, whereas if sRNA is transcribed less efficiently than its target (B), the residual unbound mRNAs code for proteins. (C) Predicted response curve of a target gene. The blue line depicts the idealized threshold-linear mode of regulation in which gene expression is completely silenced if the target transcription rate is below a threshold set by the transcription rate of the sRNA (indicated by the dashed line). Above this threshold, gene expression increases linearly with the difference between the mRNA and sRNA transcription rates. The idealized scenario is expected when binding between sRNA and mRNA occurs extremely rapidly. The red line is the actual response expected according to Equation 2, using the estimated parameters of Table 1, column 3 for αs = 1 nM/min.
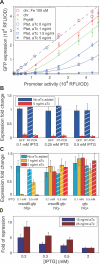
Figure 2. Threshold-Linear Response of a Reporter Target of RyhB
(A) GFP expressions of various rhyB+ strains (red: strain ZZS22, green: ZZS24, blue: ZZS23) are plotted against the promoter activity, defined as the GFP expression of the ryhB − strain (ZZS21) grown in identical medium (see Table 2 for information on the strains). Different promoter activities were obtained by varying IPTG concentration in the media (for example, the blue symbols were measured at 0, 0.05, 0.15, 0.2, 0.25 0.3, 0.4, 0.5 mM IPTG; see Figure S3). The curves are obtained from a single parameter fit of the data to the steady-state solution (Equation 2), as explained in the text and Table S1. (B) Ratio of GFP expression in the ryhB+ strain ZZS23 (harboring PLtet-O1:ryhB) and the RyhB-less strain ZZS21 measured through GFP fluorescence (solid bars) and RT-PCR (striped bars), for two different levels of aTc (blue and red) and three different levels of IPTG. In each case examined, the fold-change in GFP expression corresponded well to the fold-change in mRNA level. (C) Different RyhB levels (synthesized from PLtet-O1 :ryhB driven by different levels of aTc) do not significantly change GFP expression in hfq − strains (middle group), or when crsodB-gfp is replaced by a gfp with a short 5′-UTR (right group). GFP fluorescence was measured in hfq − strains that express a plasmid-borne target (PLlac-O1:crsodB-gfp) with (ZZS23q) or without (ZZS21q) plasmid-borne RyhB. The ratio between the two at different levels of inducers is plotted in the middle group of bars. Similarly, GFP fluorescence was measured in strains carrying the pZE12G plasmid, in which the gfp structure gene with a short 5′-UTR is placed immediately downstream of the promoter, with (ZZS13) or without (ZZS11) plasmid-borne RyhB. The ratio between the two is plotted in the right group of bars. For comparison, data for the isogenic hfq+ strains with the crsodB-gfp reporter are taken from (A) and replotted in the same format as the left group. (D) The fluorescence levels of cells expressing GFP by PLlac-O1:crsodB-gfp inserted chromosomally at the attP site was measured by flow-cytometry for strains ZZS43 (no ryhB), ZZS41 (plasmid-borne PLtet-O1:ryhB), and ZZS01 (which contained no gfp gene). The latter was used to quantify the background fluorescence level. The fold of repression (vertical axis), is defined as [fluorescence(ZZS41) − fluorescence (ZZS01)]/[fluorescence (ZZS43) − fluorescence (ZZS01)]. The data show that the repression effect of RyhB is reduced at higher levels of IPTG, corresponding to larger transcription rates of the target. For the ease of comparison, the GFP fluorescence data of (A) is replotted in the same manner in Figure S4, where similar behavior is seen. These results show that the nonlinear effect of RyhB is also exhibited by a chromosomally encoded target.
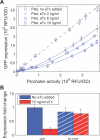
Figure 3. Threshold-Linear Response of a Reporter Target of RNA-OUT
(A) GFP expressions of strain ZZS35 (is10out+) are plotted on the vertical axis against the promoter activity, defined (as in Figure 2) as the GFP expression of strain ZZS31 (is10out−) grown in identical medium. The different symbols correspond to the different levels of RNA-OUT expressed by the PLtet-O1 promoter. The latter was controlled by varying amounts of aTc added to the growth medium (see legend). The solid lines are the steady-state solution (Equation 2) using the best-fit parameters listed in Table S2. (B) Ratio of GFP expression in is10out+ (ZZS35) and is10out− (ZZS31) strains measured through GFP fluorescence (solid bars) and RT-PCR (striped bars). Expression of RNA-OUT was induced by 10 ng/ml aTc (red), whereas target expression was induced with 0.3 mM IPTG [corresponding to the 4th diamond from the right in (A)]. Change in the mRNA level of cris10-gfp (striped bars) is insignificant compared with changes in GFP fluorescence (solid bars).
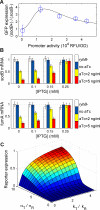
Figure 4. Cross-Talk between Different Targets of a Common sRNA
(A) The fold-change between expression of the plasmid-borne reporter target crsodB-gfp in strain ZZS22 (sodB+) and strain ZZS22s (sodB−) cells. Promoter activity of the reporter was controlled by IPTG. The black line depicts the steady-state solution of a coupled-degradation model which is a straightforward generalization of the model (Equation 1) to the case of two targets (Text S1). (B) The effect of the expression of the multicopy target reporter on the expression of chromosomal targets. mRNA levels of two chromosomal RyhB targets, sodB and fumA, were determined using RT-PCR in strains with (ZZS23) and without (ZZS21) the ryhB plasmid. The repression effect of RyhB is measured as the ratio between mRNA levels in the two strains. As the expression level of the synthetic target, crsodB-gfp, is increased (by increasing IPTG concentration), the repression effect on the chromosomal targets is reduced. (C) Predictions of the coupled degradation model (Equation 5 of Text S1) for the expression of the reporter gene (geneR) to different transcription levels (αT) of another target (geneT). To generate the figure, we chose the transcription rate of geneR (αR) to be five times smaller than that of the sRNA, i.e., with αS = 5αR. The ratio between the binding strengths of geneT (k T ) and geneR (k R ) to the sRNA determines the level of influence geneT has on the expression of geneR, and the abruptness at the onset of geneR activity. See text for details.
Figure 5. Comparison between sRNA- and Protein-Mediated Repression
(A) Steady-state solution of model (1), with the estimated parameters of Table 1. The strength of sRNA repression decreases as the target transcription increases. (B) Steady-state solution of a model for protein regulators (Supporting Text S1), where the strength of repression is independent of target transcription rate. (C) Temporal behavior in a single stochastic simulation [94] of the expression of two model genes, geneA (blue line) and geneP (red), regulated by sRNA and protein regulators respectively. For geneA we set α_A_ = 1/min and kA = 0.02/min, while for geneP we have αP = 0.0043/min and kP = 0. All other parameters are taken from Table 1 and are identical for both genes. This choice of parameters makes the mean mRNA levels of the two genes equal. The bursty nature of the noise for geneP is compared with the smooth fluctuations exhibited by geneA.
Similar articles
- Engineering artificial small RNAs for conditional gene silencing in Escherichia coli.
Sharma V, Yamamura A, Yokobayashi Y. Sharma V, et al. ACS Synth Biol. 2012 Jan 20;1(1):6-13. doi: 10.1021/sb200001q. Epub 2011 Aug 29. ACS Synth Biol. 2012. PMID: 23651005 - Translational control and target recognition by Escherichia coli small RNAs in vivo.
Urban JH, Vogel J. Urban JH, et al. Nucleic Acids Res. 2007;35(3):1018-37. doi: 10.1093/nar/gkl1040. Epub 2007 Jan 30. Nucleic Acids Res. 2007. PMID: 17264113 Free PMC article. - Genetic screens to identify bacterial sRNA regulators.
Mandin P. Mandin P. Methods Mol Biol. 2012;905:41-60. doi: 10.1007/978-1-61779-949-5_4. Methods Mol Biol. 2012. PMID: 22735997 - Expanding control in bacteria: interplay between small RNAs and transcriptional regulators to control gene expression.
Mandin P, Guillier M. Mandin P, et al. Curr Opin Microbiol. 2013 Apr;16(2):125-32. doi: 10.1016/j.mib.2012.12.005. Epub 2013 Feb 13. Curr Opin Microbiol. 2013. PMID: 23415757 Review. - How to find small non-coding RNAs in bacteria.
Vogel J, Sharma CM. Vogel J, et al. Biol Chem. 2005 Dec;386(12):1219-38. doi: 10.1515/BC.2005.140. Biol Chem. 2005. PMID: 16336117 Review.
Cited by
- A kinetic model for RNA-interference of focal adhesions.
Hoffmann M, Schwarz US. Hoffmann M, et al. BMC Syst Biol. 2013 Jan 12;7:2. doi: 10.1186/1752-0509-7-2. BMC Syst Biol. 2013. PMID: 23311633 Free PMC article. - Cycling of RNAs on Hfq.
Wagner EG. Wagner EG. RNA Biol. 2013 Apr;10(4):619-26. doi: 10.4161/rna.24044. Epub 2013 Mar 6. RNA Biol. 2013. PMID: 23466677 Free PMC article. Review. - Multidrug Resistance Regulators MarA, SoxS, Rob, and RamA Repress Flagellar Gene Expression and Motility in Salmonella enterica Serovar Typhimurium.
Thota SS, Chubiz LM. Thota SS, et al. J Bacteriol. 2019 Nov 5;201(23):e00385-19. doi: 10.1128/JB.00385-19. Print 2019 Dec 1. J Bacteriol. 2019. PMID: 31501286 Free PMC article. - Self-replenishment cycles generate a threshold response.
Kurata H. Kurata H. Sci Rep. 2019 Nov 20;9(1):17139. doi: 10.1038/s41598-019-53589-1. Sci Rep. 2019. PMID: 31748624 Free PMC article. - Transcription by the numbers redux: experiments and calculations that surprise.
Garcia HG, Sanchez A, Kuhlman T, Kondev J, Phillips R. Garcia HG, et al. Trends Cell Biol. 2010 Dec;20(12):723-33. doi: 10.1016/j.tcb.2010.07.002. Trends Cell Biol. 2010. PMID: 20801657 Free PMC article. Review.
References
- Bartel DP. MicroRNAs: Genomics, biogenesis, mechanism, and function. Cell. 2004;116:281–297. - PubMed
- Gottesman S. Micros for microbes: Non-coding regulatory RNAs in bacteria. Trends Genet. 2005;21:399–404. - PubMed
- Storz G, Altuvia S, Wassarman KM. An abundance of RNA regulators. Annu Rev Biochem. 2005;74:199–217. - PubMed
- Zamore PD, Haley B. Ribo-gnome: The big world of small RNAs. Science. 2005;309:1519–1524. - PubMed
- Repoila F, Majdalani N, Gottesman S. Small non-coding RNAs, co-ordinators of adaptation processes in Escherichia coli: The RpoS paradigm. Mol Microbiol. 2003;48:855–861. - PubMed
Publication types
MeSH terms
Substances
LinkOut - more resources
Full Text Sources
Other Literature Sources
Molecular Biology Databases


