Disorganized microtubules underlie the formation of retraction bulbs and the failure of axonal regeneration - PubMed (original) (raw)
Disorganized microtubules underlie the formation of retraction bulbs and the failure of axonal regeneration
Ali Ertürk et al. J Neurosci. 2007.
Abstract
Axons in the CNS do not regrow after injury, whereas lesioned axons in the peripheral nervous system (PNS) regenerate. Lesioned CNS axons form characteristic swellings at their tips known as retraction bulbs, which are the nongrowing counterparts of growth cones. Although much progress has been made in identifying intracellular and molecular mechanisms that regulate growth cone locomotion and axonal elongation, a comprehensive understanding of how retraction bulbs form and why they are unable to grow is still elusive. Here we report the analysis of the morphological and intracellular responses of injured axons in the CNS compared with those in the PNS. We show that retraction bulbs of injured CNS axons increase in size over time, whereas growth cones of injured PNS axons remain constant. Retraction bulbs contain a disorganized microtubule network, whereas growth cones possess the typical bundling of microtubules. Using in vivo imaging, we find that pharmacological disruption of microtubules in growth cones transforms them into retraction bulb-like structures whose growth is inhibited. Correspondingly, microtubule destabilization of sensory neurons in cell culture induces retraction bulb formation. Conversely, microtubule stabilization prevents the formation of retraction bulbs and decreases axonal degeneration in vivo. Finally, microtubule stabilization enhances the growth capacity of CNS neurons cultured on myelin. Thus, the stability and organization of microtubules define the fate of lesioned axonal stumps to become either advancing growth cones or nongrowing retraction bulbs. Our data pinpoint microtubules as a key regulatory target for axonal regeneration.
Figures
Figure 1.
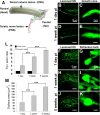
Retraction bulbs, but not growth cones, increase in size over time. GFP-M mice were anesthetized, the sciatic nerve or the dorsal columns were injured, the mice were then killed at various postinjury times, and the tissue was fixed and analyzed by confocal microscopy. A, Drawing of the spinal cord depicting the DRG neurons and their axons in the spinal cord and sciatic nerve. A representative DRG neuron is highlighted; the cell body residing in the dorsal root is shown in blue, the central branch of the axon in green, and the peripheral branch in red. The site of dorsal column transection to lesion the central axonal branches and the site of sciatic nerve crush to lesion the peripheral axonal branches are indicated by black arrows. B–E, Growth cones at 1 d (B) and 1 week (D) after sciatic nerve crush; higher magnifications of B and D are shown in C and E, respectively. F–K, Retraction bulbs at 1 d (F), 1 week (H), and 5 weeks (J) after dorsal column lesion; higher magnifications of marked areas in F, H, and J are shown in G, I, and K, respectively. Note that some of the axons possess smaller swellings on the shaft in addition to the big terminal bulbs (I, K). L, Size comparison of growth cones and retraction bulbs by tip/axonal shaft ratio. Although the sizes of retraction bulbs increase, the sizes of growth cones remain constant over time. M, Absolute size increase of retraction bulbs over time analyzed by surface area quantification. All values are average ± SD. L, M, ***p < 0.001. pi, Postinjury. Scale bars: B, D, F, H, J, 75 μm; C, E, G, I, K, 5 μm.
Figure 2.
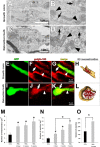
Retraction bulbs contain mitochondria and _trans_-Golgi-network (TGN)-derived vesicles. A–D, EM was used to analyze the morphology and quantity of vesicles and mitochondria. Electron micrographs show a growth cone 2 d after sciatic nerve crush (A) and a retraction bulb 4 d after dorsal column lesion (C). Accumulation of mitochondria and vesicles is observed in the end structures. B, D, Higher magnification of the areas marked in A and C, respectively. Black arrows show some of the vesicles, and black arrowheads indicate some of the mitochondria in the end structures. E–L, Localization of vesicles shown by immunofluorescent labeling with anti-golgin-160 antibody, specific for TGN-derived vesicles. E, I, GFP-positive end structures (green); F, J, labeled vesicles (red); G, K, overlay of GFP and golgin-160 signal. F, G, J, K, White arrows indicate the vesicles that accumulate in the end structures, and white arrowheads indicate vesicles in the axon shaft. H, L, 3D reconstruction of the confocal images in G and K, respectively. The red particles are vesicles; the outline of the end structures is partially depicted in shaded beige. M–O, Concentration of mitochondria (M) and vesicles (N) in the growth cones at 2 d and in retraction bulbs at various time points after injury as calculated from electron micrographs. O, Concentration of vesicles in the growth cones at 2 d and retraction bulbs at 2 weeks derived from 3D volumetric quantifications. The volume of vesicles in the end structures is shown in percentages. GCs, Growth cones; RBs, retraction bulbs. M–O, *p < 0.05 between retraction bulbs at that time point and growth cones at 2 d after injury.
Figure 3.
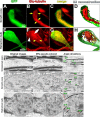
Retraction bulbs have dispersed and disorganized microtubules. A–H, Immunostaining of axonal end structures with anti-Glu-tubulin antibody, recognizing the detyrosinated α-tubulin subunits, which are already assembled into microtubules, to visualize the organization of microtubules. A–D, Growth cones possess tightly bundled microtubules parallel to the axonal axis. GFP-positive growth cone (green; A), anti-Glu-tubulin staining (red; B), merge (C), and 3D reconstruction (D) are shown. B, D, The arrows (B) and arrowheads (D) point to some of the parallel microtubule bundles. E–H, Retraction bulbs have highly dispersed and disorganized microtubules. GFP-positive retraction bulb (green; E), anti-Glu-tubulin staining (red; F), merge (G), and 3D reconstruction (H) are shown. F, H, The yellow arrows (F) and arrowheads (H) indicate dispersed microtubules that are highly deviated. F, The white arrow indicates regions in which microtubules are densely accumulated, and the white arrowhead indicates regions without microtubules. I–R, Electron micrographs of retraction bulbs and growth cones were analyzed to quantify the angle of deviation of microtubules. Unlesioned central axons were also quantified as a control. A representative unlesioned CNS axon (I), growth cone (L), and retraction bulb (O) are shown. J, M, P, The microtubules in I, L, and O were manually traced in black to visualize the overall microtubule organization in the axonal structures. K, N, R, Higher magnifications of the marked areas in J, M, and P, respectively. The angles between the traced microtubules and the axonal axis were quantified (see Fig. 4).
Figure 4.
Quantification of the microtubule deviation from the axonal axis. Each dot represents a single microtubule filament (at least 7 electron micrographs were analyzed and pooled for each condition). The microtubules are significantly more vertical in the retraction bulbs than in either growth cones or unlesioned central axons (p < 0.001).
Figure 5.
Nocodazole application converts a growth cone into a retraction bulb-like structure and restricts axonal growth in vivo. A–K, One day after sciatic nerve injury, GFP-M mice were reanesthetized, and their sciatic nerves were exposed. The exposed sciatic nerves were treated with 10 μl of either 330 μ
m
nocodazole (D–F, H–K) or 5% DMSO as control (A–C). The effects on the morphology and the cytoskeletal structure were assessed 24 h after the treatment. A, The morphology of the growth cones does not change under control conditions. Growth cones treated with 5% DMSO resemble untreated growth cones. B, C, Higher magnifications of the growth cones marked with arrowheads in A. D, After treatment with nocodazole, the axons form bulbs at their tips instead of growth cones. E, F, Higher magnifications of the peripheral bulbs marked with arrowheads in D. G, Quantification of peripheral bulb sizes. The tip/axon ratio of the peripheral bulbs is significantly higher than that of either DMSO-treated growth cones or untreated growth cones (***p < 0.001). All values are average ± SD. H–K, The nocodazole-treated peripheral bulb (H) immunostained with an anti-Glu-tubulin antibody (I) to assess the underlying microtubule organization. The white arrowheads in I and yellow arrowheads in 3D reconstruction (K) point to some of the microtubules, which are dispersed in a way similar to that observed in retraction bulbs (compare with Fig. 3_E–H_). L–O, Two days after sciatic nerve injury, the lesion site was reexposed, and binocular images were captured before the treatments. Immediately after the imaging, 10 μl of 330 μ
m
nocodazole (after N) or 5% DMSO (after L) were applied. The positions of the axonal tips were followed over 6 h. O, The nocodazole-treated axonal tip in N remained at its position 6 h after treatment. The tip of this axon is marked by red arrowheads in N and O. L, M, The DMSO-treated growth cone extends during the time of imaging. The tip of this axon is followed by the green arrowheads. The images are aligned with the purple dashed lines with respect to the landmarks, the vertical vessels, which remained at the same position during imaging. P, Quantification of the relative growth of axon terminals after nocodazole and DMSO treatments. Only the axons that were clearly visible at each imaging time have been considered and averaged for each animal. Each green bar represents one control, and each red bar represents one nocodazole-treated animal. Scale bars: L–O, 100 μm.
Figure 6.
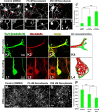
Nocodazole application converts the axon terminals into retraction bulb-like swellings and inhibits axonal growth in vitro. A–I, DRG neurons from adult rats were cultured on laminin for 48 h. A, D, G, From 24 to 48 h, the neurons were incubated with 0.33% DMSO (control; A), 75 n
m
nocodazole (D), or 250 n
m
nocodazole (G). B, C, Higher magnifications from A showing in vitro DRG growth cones. E and F, H and I, Higher magnifications from D and G, respectively, showing the retraction bulb-like swellings in vitro after nocodazole treatments. J, Quantification of the retraction bulbs formed at the axonal endings in percentages. Nocodazole treatments (75 and 250 n
m
) induce significantly more bulbous endings than control treatments (**p < 0.05). K, L, The microtubule organization of the control and 250 n
m
nocodazole-treated axonal endings, which were identified by immunostaining with a general neuronal tubulin antibody recognizing class III β-tubulin (TuJ1) and with anti-Glu-tubulin antibody. K1–K4, Similar to in vivo growth cones, in vitro growth cones possess bundled microtubules. L1–L4, In contrast, the nocodazole-induced bulbous axon terminals contain disorganized microtubules similar to their in vivo counterparts. M–P, The growth of the axons after treatments was analyzed by calculating the total length of the axons per DRG neuron. _TuJ1_-stained neurons were imaged by confocal microscopy under identical conditions and quantified. M–O, Control (M) and 75 n
m
nocodazole- (N) and 250 n
m
nocodazole (O)-treated DRG neurons. P, Quantification of the average total length of the axons per DRG neuron. There is a significant decrease in the length of nocodazole-treated DRG axons compared with controls. **p < 0.05. Scale bars: A, D, G, 30 μm; B, C, E, F, H, I, 10 μm; M–O, 200 μm.
Figure 7.
Taxol application interferes with the formation of retraction bulbs. A–D, In vivo imaging to identify effect of the taxol versus control after a small lesion on dorsal column (A, B). Ten microliters of 1 μ
m
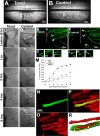
taxol (C) or saline (D) were applied repetitively (once per hour) starting immediately after injury (0 h). The lesion sites before and after injury (up to 6 h after injury) in taxol (C) and saline (D) applications are shown from top to bottom. One hour after injury, the first retraction bulbs form in control animals (C) but not in the taxol-applied animals (D). Although most of the axons form retraction bulbs after 6 h in the control, only a minority of taxol-treated animals show axons forming retraction bulbs (compare C, D, 6 h time point). E, F, Confocal image of the lesion sites at 6 h after injury from the same animals shown in C and D, respectively. The dotted lines indicate the injury sites. E, The red arrow indicates an axon that is within a few micrometer proximity of the lesion site. G–L, Higher magnifications of the axon terminals indicated in E and F (the biggest ones from the samples); G–I, the taxol-treated axon terminals; J–L, the control-treated axon terminals. Note that the sizes of the taxol-treated axonal endings are smaller than the retraction bulbs in controls. M, The percentage of axons with retraction bulbs (RBs) in taxol-treated (white circles; n = 11 animals) compared with saline (control)-treated animals (dark circles; n = 18 animals). From 1 h after injury on, there are significantly less bulbs in taxol-treated animals (*p < 0.05; ***p < 0.001). N–R, The Glu-tubulin antibody was used to identify microtubule structure of taxol-treated central axon terminals. GFP-positive axon in green (N), the anti-Glu-tubulin antibody staining in red (O), the merge image (P), and the 3D reconstruction of the presented sample (R) are shown. Note that the microtubules are highly parallel to the axonal axis and mostly bundled as seen in the growth cones. R, The yellow arrowheads focus on some of the microtubules aligned in parallel bundles. Scale bars: G–L, 20 μm.
Figure 8.
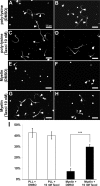
Taxol treatment increases the growth capacity of neurons in culture. A–H, CGNs were cultured either on poly-lysine (A–D) or on an inhibitory substrate (myelin; E–H). A, B, Most of the CGNs cultured on poly-lysine form long axons (42.9 ± 4.1% of the cells had processes longer than 60 μm) within a short time (18 h). C, D, Treatment of CGNs cultured on poly-lysine does not change the growth capacity of these neurons (40.4 ± 3.3% of the cells had processes longer than 60 μm). E, F, CGNs cultured on myelin show reduced axonal growth: only 7.5 ± 2.67% of the cells have processes longer than 60 μm. G, H, Treatment of CGNs with 10 n
m
taxol largely rescues the formation of long axons on an inhibitory myelin substrate, resulting in 29.9 ± 2.35% of CGNs with axons longer than 60 μm. A–H, Arrowheads indicate axons. I, The percentage of the neurites that are longer than 60 μm is plotted for each condition. ***p < 0.001. Scale bars: A–H, 100 μm. The data are shown as average ± SD; n ≥ 3 independent experiments per condition. PLL, Poly-lysine.
Figure 9.
Model for retraction bulb formation versus growth cone-mediated regeneration. A, D, Before injury, PNS and CNS axons are connected to their targets and are functional. An injury (red flashes) to a CNS axon (A) or PNS axon (D) results in disconnection of the axon from the target tissue. B, E, A few days after injury, the axonal part distal from the lesion site dies back (not shown). The CNS axon proximal to axotomy responds to injury by forming a retraction bulb (B), which is characterized by dispersed stable and dynamic microtubules and accumulated organelles including _trans_-Golgi-derived vesicles and mitochondria. Stabilization of the microtubules starting immediately after injury (from A) inhibits the formation of retraction bulbs and can furthermore induce axon outgrowth. The PNS axon forms a growth cone after a lesion (E), which efficiently uses membrane trafficking, energy, and an intact cytoskeleton for elongation. Stable microtubules are aligned in parallel bundles and serve as tracks for organelle transport to support the rapidly advancing growth cone and to form the backbone of the growing axon. Dynamic microtubules reach the axonal tip. Destabilization of microtubules at this level can convert the growth cones into retraction bulb-like structures containing dispersed microtubule organization. C, A few weeks after injury, the retraction bulb still enlarges with the accumulation of organelles as a result of a continuous membrane traffic. F, In contrast, the PNS axon continues its rapid elongation until finding and connecting to the target.
Similar articles
- Antagonistic forces generated by cytoplasmic dynein and myosin-II during growth cone turning and axonal retraction.
Myers KA, Tint I, Nadar CV, He Y, Black MM, Baas PW. Myers KA, et al. Traffic. 2006 Oct;7(10):1333-51. doi: 10.1111/j.1600-0854.2006.00476.x. Epub 2006 Aug 15. Traffic. 2006. PMID: 16911591 - Microtubule reconfiguration during axonal retraction induced by nitric oxide.
He Y, Yu W, Baas PW. He Y, et al. J Neurosci. 2002 Jul 15;22(14):5982-91. doi: 10.1523/JNEUROSCI.22-14-05982.2002. J Neurosci. 2002. PMID: 12122060 Free PMC article. - Myelin-associated glycoprotein reduces axonal branching and enhances functional recovery after sciatic nerve transection in rats.
Tomita K, Kubo T, Matsuda K, Yano K, Tohyama M, Hosokawa K. Tomita K, et al. Glia. 2007 Nov 1;55(14):1498-507. doi: 10.1002/glia.20566. Glia. 2007. PMID: 17705198 - Microtubule Dynamics Following Central and Peripheral Nervous System Axotomy.
Kulkarni R, Thakur A, Kumar H. Kulkarni R, et al. ACS Chem Neurosci. 2022 May 4;13(9):1358-1369. doi: 10.1021/acschemneuro.2c00189. Epub 2022 Apr 22. ACS Chem Neurosci. 2022. PMID: 35451811 Review. - Growing the growth cone: remodeling the cytoskeleton to promote axon regeneration.
Hur EM, Saijilafu, Zhou FQ. Hur EM, et al. Trends Neurosci. 2012 Mar;35(3):164-74. doi: 10.1016/j.tins.2011.11.002. Epub 2011 Dec 5. Trends Neurosci. 2012. PMID: 22154154 Free PMC article. Review.
Cited by
- Crmp4 deletion promotes recovery from spinal cord injury by neuroprotection and limited scar formation.
Nagai J, Kitamura Y, Owada K, Yamashita N, Takei K, Goshima Y, Ohshima T. Nagai J, et al. Sci Rep. 2015 Feb 5;5:8269. doi: 10.1038/srep08269. Sci Rep. 2015. PMID: 25652774 Free PMC article. - Calcium channel inhibition-mediated axonal stabilization improves axonal regeneration after optic nerve crush.
Ribas VT, Lingor P. Ribas VT, et al. Neural Regen Res. 2016 Aug;11(8):1245-6. doi: 10.4103/1673-5374.189184. Neural Regen Res. 2016. PMID: 27651770 Free PMC article. No abstract available. - Computational modeling of axonal microtubule bundles under tension.
Peter SJ, Mofrad MR. Peter SJ, et al. Biophys J. 2012 Feb 22;102(4):749-57. doi: 10.1016/j.bpj.2011.11.4024. Epub 2012 Feb 21. Biophys J. 2012. PMID: 22385845 Free PMC article. - Overexpressing eukaryotic elongation factor 1 alpha (eEF1A) proteins to promote corticospinal axon repair after injury.
Romaus-Sanjurjo D, Saikia JM, Kim HJ, Tsai KM, Le GQ, Zheng B. Romaus-Sanjurjo D, et al. Cell Death Discov. 2022 Sep 20;8(1):390. doi: 10.1038/s41420-022-01186-z. Cell Death Discov. 2022. PMID: 36123349 Free PMC article. - Rat embryonic hippocampus and induced pluripotent stem cell derived cultured neurons recover from laser-induced subaxotomy.
Selfridge A, Hyun N, Chiang CC, Reyna SM, Weissmiller AM, Shi LZ, Preece D, Mobley WC, Berns MW. Selfridge A, et al. Neurophotonics. 2015 Jan;2(1):015006. doi: 10.1117/1.NPh.2.1.015006. Epub 2015 Feb 13. Neurophotonics. 2015. PMID: 26157985 Free PMC article.
References
- Araujo Couto L, Sampaio Narciso M, Hokoc JN, Blanco Martinez AM. Calpain inhibitor 2 prevents axonal degeneration of opossum optic nerve fibers. J Neurosci Res. 2004;77:410–419. - PubMed
- Balentine JD, Spector M. Calcification of axons in experimental spinal cord trauma. Ann Neurol. 1977;2:520–523. - PubMed
- Bosse F, Hasenpusch-Theil K, Kury P, Muller HW. Gene expression profiling reveals that peripheral nerve regeneration is a consequence of both novel injury-dependent and reactivated developmental processes. J Neurochem. 2006;96:1441–1457. - PubMed
- Bradke F, Dotti CG. Neuronal polarity: vectorial cytoplasmic flow precedes axon formation. Neuron. 1997;19:1175–1186. - PubMed
Publication types
MeSH terms
Substances
LinkOut - more resources
Full Text Sources
Other Literature Sources
