Overexpression of the cytosolic form of phosphoenolpyruvate carboxykinase (GTP) in skeletal muscle repatterns energy metabolism in the mouse - PubMed (original) (raw)
. 2007 Nov 9;282(45):32844-55.
doi: 10.1074/jbc.M706127200. Epub 2007 Aug 23.
Jianqi Yang, Gemma Casadesus, Duna Massillon, Fatima Tolentino-Silva, Colleen K Nye, Marco E Cabrera, David R Hagen, Christopher B Utter, Yacoub Baghdy, David H Johnson, David L Wilson, John P Kirwan, Satish C Kalhan, Richard W Hanson
Affiliations
- PMID: 17716967
- PMCID: PMC4484620
- DOI: 10.1074/jbc.M706127200
Overexpression of the cytosolic form of phosphoenolpyruvate carboxykinase (GTP) in skeletal muscle repatterns energy metabolism in the mouse
Parvin Hakimi et al. J Biol Chem. 2007.
Abstract
Transgenic mice, containing a chimeric gene in which the cDNA for phosphoenolpyruvate carboxykinase (GTP) (PEPCK-C) (EC 4.1.1.32) was linked to the alpha-skeletal actin gene promoter, express PEPCK-C in skeletal muscle (1-3 units/g). Breeding two founder lines together produced mice with an activity of PEPCK-C of 9 units/g of muscle (PEPCK-C(mus) mice). These mice were seven times more active in their cages than controls. On a mouse treadmill, PEPCK-C(mus) mice ran up to 6 km at a speed of 20 m/min, whereas controls stopped at 0.2 km. PEPCK-C(mus) mice had an enhanced exercise capacity, with a VO(2max) of 156 +/- 8.0 ml/kg/min, a maximal respiratory exchange ratio of 0.91 +/- 0.03, and a blood lactate concentration of 3.7 +/- 1.0 mm after running for 32 min at a 25 degrees grade; the values for control animals were 112 +/- 21 ml/kg/min, 0.99 +/- 0.08, and 8.1 +/- 5.0 mm respectively. The PEPCK-C(mus) mice ate 60% more than controls but had half the body weight and 10% the body fat as determined by magnetic resonance imaging. In addition, the number of mitochondria and the content of triglyceride in the skeletal muscle of PEPCK-C(mus) mice were greatly increased as compared with controls. PEPCK-C(mus) mice had an extended life span relative to control animals; mice up to an age of 2.5 years ran twice as fast as 6-12-month-old control animals. We conclude that overexpression of PEPCK-C repatterns energy metabolism and leads to greater longevity.
Figures
FIGURE 1. Generation of PEPCK-Cmus mice
A, a chimeric gene containing 2 kb of the human α-skeletal actin gene promoter, linked to the cDNA for PEPCK-C from the mouse followed by the 3′-end of bGH (see “Experimental Procedures” for details). The hatched bar represents the DNA probe that was used for Southern blotting genomic DNA from the mice. B, a schematic illustration of two copies of the transgene integrated into the host cell genome. PstI digestion of genomic DNA results in a 1.9-kb fragment and fragments of various lengths, depending upon the location of other PstI sites in the genome. The hatched bar represents the DNA probe that was used for Southern blotting genomic DNA from the mice. The Southern blot shown in B is for DNA from founder lines A, B, C, D, and wild type (WT) mice. The pattern of DNA for the cross between founder lines C and D (CD) is also shown in the last two lanes; the homozygous CD mice are termed PEPCK-Cmus mice. C, a schematic representation of the CD cross to generate the PEPCK-Cmus mice used in these studies. This panel illustrates the level of activity of PEPCK-C in the skeletal muscle of mice at various stages of interbreeding. Mice heterozygous for either the C or the D genotypes had an activity of PEPCK-C between 1.2 and 3.4 units/g of skeletal muscle (it was not possible to distinguish between the specific genotypes of these mice by Southern blotting). The values for the activity of PEPCK-C for the PEPCK-Cmus mice and wild type animals are presented as the mean ± the S.E. of the mean for the number of mice shown in parentheses. D, a Northern blot of the PEPCK-C mRNA in the skeletal muscle of CD mice and control animals (WT). The PEPCK-C mRNA in the liver is also presented as a positive control. E, a Western blot of the PEPCK-C from the liver, heart, kidney, and skeletal muscle (S. Muscle) of PEPCK-Cmus mice and controls (WT).
FIGURE 2. The home cage activity of PEPCK-Cmus mice
The activity of PEPCK-Cmus mice and controls (WT), maintained with a 12-h light/dark cycle, was determined as outlined under “Experimental Procedures.” The measurements made over 22 h included the distance covered, the velocity of the movement, the rearing frequency, and the percentage of time the mice were strongly mobile.
FIGURE 3. PEPCK-Cmus mice run for a long distance on a treadmill
Untrained 3-month-old PEPCK-Cmus mice and controls (WT) were tested for their ability to run long distances. The mice were placed on a treadmill (at a grade of 0°) and run at 20 m/min until exhaustion, as described in the first protocol under “Experimental Procedures.” In the supplemental data, please note that a video is available that documents the remarkable ability of the PEPCK-Cmus mice to run for long distances.
FIGURE 4. A graphical plot of fuel utilization by a PEPCK-Cmus and control mouse during strenuous exercise
This figure is a graphical plot of the alterations in the RER of an untrained PEPCK-Cmus mouse and a control animal. The data are drawn from a larger group of PEPCK-Cmus mice (_n_= 9) and control littermates (_n_= 10) that is presented in Table 3. The RER was assessed using a speed-ramped treadmill entirely enclosed in an environmental chamber and equipped to measure changes in oxygen consumption and carbon dioxide output. The mice were acclimated to the chamber for 60 min, after which the speed of the treadmill (set at a 25° slope) was set at 10 m/min and for 30 min and then increased 2 m/min every 2 min until the mice reached exhaustion (see the second protocol described under “Experimental Procedures”). A blood sample was taken before and after exercise for the measurement of lactate. Both the rate of oxygen consumption and the rate of carbon dioxide generation by the mice were monitored continuously throughout the exercise period.
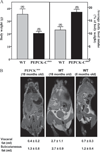
FIGURE 5. Food intake and relative body fat of PEPCK-Cmus mice and controls
A, The average daily food consumption (right panel), as related to the body weight of the mice, was calculated for five control (WT) and 17 PEPCK-Cmus mice daily over a 3-week period. The body weight (left) of the same mice was determined three times a week over a 3-week period. The values are presented as the mean ± S.E. of the mean. B, magnetic resonance imaging showing hyper-intense adipose tissue due to T1-weighting. Animals are an 18-month-old PEPCK-Cmusmouse(CD18), an 18-month-old control (WT), and a 6-month-old control (WT). Volumes of visceral and subcutaneous adipose tissues were calculated as outlined under “Experimental Procedures.”
FIGURE 6. The relationship between the concentration of triglyceride and the activity of PEPCK-C in the skeletal muscle of PEPCK-Cmus mice and control (WT) animals
The activity of PEPCK-C and the concentration of triglyceride in skeletal muscle were determined as described under “Experimental Procedures.” The unit of activity is 1 µmol of substrate converted to product per min at 37 °C.
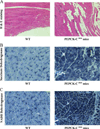
FIGURE 7. Histological analysis of skeletal muscle from PEPCK-Cmus mice and controls
A, hematoxylin and eosin staining (H & E staining) of skeletal muscle showing lipid inclusions in the muscle of the PEPCK-Cmus mice. B, succinate dehydrogenase staining. C, NADH dehydrogenase staining. All slides are at X200 magnification.
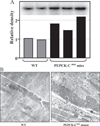
FIGURE 8. Increased mitochondrial content in skeletal muscle of PEPCK-Cmus mice
A, the relative concentration of mitochondrial DNA in skeletal muscle of PEPCK-Cmus mice and controls (WT). The inset is a Southern blot of DNA isolated from three PEPCK-Cmus mice and two control animals. B, electron micrographs of soleus muscle from PEPCK-Cmus mouse and a control animal (WT) showing an increased number of mitochondria (arrow).
FIGURE 9. Running ability of PEPCK-Cmus mice with age
Trained PEPCK-Cmus mice and controls (WT) of varying ages were tested for their ability to run on a treadmill using the third protocol as described in detail under “Experimental Procedures.” The mice were acclimated to the treadmill (at a grade of 0°) for 30 min at a speed of 10 m/min, after which time the speed of the treadmill was increased 1 m/min every min, until the mice reached exhaustion. The number of animals tested is indicated in parentheses.
Similar articles
- Born to run; the story of the PEPCK-Cmus mouse.
Hanson RW, Hakimi P. Hanson RW, et al. Biochimie. 2008 Jun;90(6):838-42. doi: 10.1016/j.biochi.2008.03.009. Epub 2008 Apr 3. Biochimie. 2008. PMID: 18394430 Free PMC article. Review. - Phosphoenolpyruvate carboxykinase cytosolic and mitochondrial isoforms are expressed and active during hypoxia in the white shrimp Litopenaeus vannamei.
Reyes-Ramos CA, Peregrino-Uriarte AB, Cota-Ruiz K, Valenzuela-Soto EM, Leyva-Carrillo L, Yepiz-Plascencia G. Reyes-Ramos CA, et al. Comp Biochem Physiol B Biochem Mol Biol. 2018 Dec;226:1-9. doi: 10.1016/j.cbpb.2018.08.001. Epub 2018 Aug 11. Comp Biochem Physiol B Biochem Mol Biol. 2018. PMID: 30107223 - Metabolic effects of developmental, tissue-, and cell-specific expression of a chimeric phosphoenolpyruvate carboxykinase (GTP)/bovine growth hormone gene in transgenic mice.
McGrane MM, Yun JS, Moorman AF, Lamers WH, Hendrick GK, Arafah BM, Park EA, Wagner TE, Hanson RW. McGrane MM, et al. J Biol Chem. 1990 Dec 25;265(36):22371-9. J Biol Chem. 1990. PMID: 1702419 - Activation of SIRT1 by resveratrol represses transcription of the gene for the cytosolic form of phosphoenolpyruvate carboxykinase (GTP) by deacetylating hepatic nuclear factor 4alpha.
Yang J, Kong X, Martins-Santos ME, Aleman G, Chaco E, Liu GE, Wu SY, Samols D, Hakimi P, Chiang CM, Hanson RW. Yang J, et al. J Biol Chem. 2009 Oct 2;284(40):27042-53. doi: 10.1074/jbc.M109.047340. Epub 2009 Aug 3. J Biol Chem. 2009. PMID: 19651778 Free PMC article. - Cell-specific expression of cytosolic phosphoenolpyruvate carboxykinase in transgenic mice.
Beale EG, Clouthier DE, Hammer RE. Beale EG, et al. FASEB J. 1992 Dec;6(15):3330-7. doi: 10.1096/fasebj.6.15.1281456. FASEB J. 1992. PMID: 1281456 Review.
Cited by
- PEPCK-C reexpression in the liver counters neonatal hypoglycemia in Pck1 del/del mice, unmasking role in non-gluconeogenic tissues.
Semakova J, Hyroššová P, Méndez-Lucas A, Cutz E, Bermudez J, Burgess S, Alcántara S, Perales JC. Semakova J, et al. J Physiol Biochem. 2017 Feb;73(1):89-98. doi: 10.1007/s13105-016-0528-y. Epub 2016 Oct 26. J Physiol Biochem. 2017. PMID: 27785616 - Myogenin regulates exercise capacity and skeletal muscle metabolism in the adult mouse.
Flynn JM, Meadows E, Fiorotto M, Klein WH. Flynn JM, et al. PLoS One. 2010 Oct 22;5(10):e13535. doi: 10.1371/journal.pone.0013535. PLoS One. 2010. PMID: 21042574 Free PMC article. - TRAIL/DR5 pathway promotes AKT phosphorylation, skeletal muscle differentiation, and glucose uptake.
Toffoli B, Tonon F, Tisato V, Zauli G, Secchiero P, Fabris B, Bernardi S. Toffoli B, et al. Cell Death Dis. 2021 Nov 16;12(12):1089. doi: 10.1038/s41419-021-04383-3. Cell Death Dis. 2021. PMID: 34789726 Free PMC article. - Effect of adeno-associated virus (AAV)-mediated overexpression of PEPCK-M (Pck2) on Clenbuterol-induced muscle growth.
Loczenski-Brown DM, Jones S, Luckett J, Daniel Z, Brearley MC, Ebling FJP, Parr T, Brameld JM. Loczenski-Brown DM, et al. PLoS One. 2019 Jun 25;14(6):e0218970. doi: 10.1371/journal.pone.0218970. eCollection 2019. PLoS One. 2019. PMID: 31237922 Free PMC article. - Chronological aging in Saccharomyces cerevisiae.
Longo VD, Fabrizio P. Longo VD, et al. Subcell Biochem. 2012;57:101-21. doi: 10.1007/978-94-007-2561-4_5. Subcell Biochem. 2012. PMID: 22094419 Free PMC article. Review.
References
- Hanson RW, Patel YM, editors. P-Enolpyruvate Carboxykinase: the Gene and the Enzyme. New York: John Wiley and Sons; 1994. pp. 203–281. - PubMed
- Zimmer DB, Magnuson MA. J. Histochem. Cytochem. 1990;38:171–178. - PubMed
- Franckhauser S, Munoz S, Pujol A, Casellas A, Riu E, Otaegui P, Su B, Bosch F. Diabetes. 2002;51:624–630. - PubMed
Publication types
MeSH terms
Substances
Grants and funding
- CA 43703/CA/NCI NIH HHS/United States
- R01 DK058620/DK/NIDDK NIH HHS/United States
- DK 025541/DK/NIDDK NIH HHS/United States
- P50 GM066309/GM/NIGMS NIH HHS/United States
- AG 12834/AG/NIA NIH HHS/United States
- DK 058620/DK/NIDDK NIH HHS/United States
- R01 AG012834/AG/NIA NIH HHS/United States
- R01 DK025541/DK/NIDDK NIH HHS/United States
- R01 EB004070/EB/NIBIB NIH HHS/United States
- EB 004070/EB/NIBIB NIH HHS/United States
- T32 EB007509/EB/NIBIB NIH HHS/United States
- R29 AG012834/AG/NIA NIH HHS/United States
- P30 CA043703/CA/NCI NIH HHS/United States
- GM 66309/GM/NIGMS NIH HHS/United States
LinkOut - more resources
Full Text Sources
Other Literature Sources
Molecular Biology Databases
Research Materials
Miscellaneous


