Morphologic characterization of organized extracellular matrix deposition by ascorbic acid-stimulated human corneal fibroblasts - PubMed (original) (raw)
Morphologic characterization of organized extracellular matrix deposition by ascorbic acid-stimulated human corneal fibroblasts
Xiaoqing Guo et al. Invest Ophthalmol Vis Sci. 2007 Sep.
Abstract
Purpose: To characterize the structure and morphology of extracellular matrix (ECM) synthesized by untransformed, cultured human corneal fibroblasts in long-term cultures.
Methods: Human corneal stromal keratocytes were expanded in transwell culture in the presence of fetal bovine serum and a stable derivative of vitamin C. The cells were allowed to synthesize a fibrillar ECM for up to 5 weeks. Constructs were assessed by light (phase-contrast and differential interference-contrast) and transmission (standard and quick freeze/deep etch) microscopy.
Results: Electron micrographs revealed stratified constructs with multiple parallel layers of cells and an extracellular matrix comprising parallel arrays of small, polydisperse fibrils (27-51 nm) that often alternate in direction. Differential interference contrast images demonstrated oriented ECM fibril arrays parallel to the plane of the construct, whereas quick-freeze, deep-etch micrographs showed the details of the matrix interaction with fibroblasts through arrays of membrane surface structures.
Conclusions: Human keratocytes, cultured in a stable vitamin C derivative, are capable of assembling extracellular matrix, which comprises parallel arrays of ECM fibrils. The resultant constructs, which are highly cellular, are morphologically similar to the developing mammalian stroma, where organized matrix is derived. The appearance of arrays of structures on the cell membranes suggests a role in the local organization of synthesized ECM. This model could provide critical insight into the fundamental processes that govern the genesis of organized connective tissues such as the cornea and may provide a scaffolding suitable for tissue engineering a biomimetic stroma.
Figures
Figure 1
Phase contrast optical micrographs of the organization of HCFs in transwell (A) At day 1, the fibroblasts cover the transwell in a monolayer of spindle-shaped cells. Bar 100 microns (B) At 1 week, the cultures have stratified to multiple layers and the cells appear to change orientation as a function of elevation above the transwell membrane. Bar = 100 microns. (C) Inset region from (B) where fibroblast orientation change appears to orthogonal. Bar = 25 microns. Images are representative of 5 experiments.
Figure 2
Transmission electron micrograph of the organization of HCF constructs. Low magnification TEM of 4 week construct shows 32 micron thick stratified cell and ECM with confluent cellular monolayers on the top surface and adjacent to the transwell membrane (arrowhead). Bar = 5 microns. Images are representative of the 5 experiments.
Figure 3
TEM micrographs of lamellar-like architecture of the constructs. (A) Low magnification view of the cells and synthesized arrays of fibrils. The arrows indicate putative “lamellae” where fibril orientation appears to change direction. Of note is the fact that the “lamellae” can extend over significant (tens of microns) distances. Bar = 2 microns. (B) Higher magnification view of the organization of fibrils and their apparent change in direction within the “lamellae”. Again, arrows indicate the location of changes in fibril orientation. Bar = 2 microns. (C) High magnification view of alternating fibril arrays in the construct. Bar = 1 micron.
Figure 4
Transmission electron micrographs of fibril morphology in HCF synthesized constructs. (A) Micrograph showing the diameter polydispersity (end view) of the forming fibrils. Fibril with diameter of 28 nm (black arrowhead) and fibril with diameter that is 45 nm (white arrowhead). Bar 500 nm (B) Higher magnification micrograph showing the typical banding pattern of the fibrils in the constructs. Bar = 200 nm. (C) Micrograph showing the presence of clusters of microfibrils which are similar to those found in developing mammalian stroma (arrow). Bar 500 nm.
Figure 5
Transmission electron micrographs of the architecture of the HCF synthesized constructs. (A) Dense parallel architecture of cells and cell processes between which the fibril formation is controlled. Note the presence of prominent RER (black arrowheads). Bar = 2 microns. (B) Fibrils are often found in close apposition and parallel to the surface of the cells in the construct (black arrowheads). Bar = 1 micron.
Figure 6
Differential Interference Contrast photomicrograph of in plane ECM alignment. (A) Low magnification DIC imaging qualitatively demonstrates the general alignment of ECM in the middle of a 4 week construct (approximately 25 microns above the transwell membrane). Note the length over which the aligned texture of the image is consistent. Bar is 10 microns. (B) High magnification DIC showing local alignment in the direction of the arrow. (C) High magnification of same x–y location in B, but displaced 5 microns deeper into construct. The direction of ECM alignment is changing relative to the matix seen in (B). Bars = 10 microns.
Figure 7
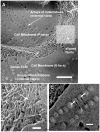
Quick Freeze/Deep Etch micrograph of 5 week construct cell membranes and extracellular matrix. (A) Low magnification image of matrix between two fibroblast cells. The cell membranes display regular arrays of “indentations” of unknown function. These regular arrays of indentations on the cell membrane (P-face) and have a nominal diameter of approximately 70 nm (but vary in size). In QFDE, which involves fracturing the specimen, the indentations appear as protrusions when the cell membrane is viewed from “inside the cell” (E-face). Bar = 500 nm (B) High magnification of the matrix demonstrates that aligned fibrils are immersed in a dense, less regular ECM. The fibril diameters vary from fibril to fibril and along the axis. Bar = 100 nm. (C) Highly organized array of indentations on cell membrane (E-face). The array is closely spaced in one direction (100 nm - white arrows) and more widely spaced in the other (150+ nm - black arrows). Bar = 100 nm.
Figure 8
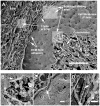
QFDE micrographs of cell matrix interaction in 5 week construct. (A) Low magnification of a cell’s interaction with the neighboring ECM. The image shows the intracellular matrix (ICM), the extracellular matrix (ECM), the outside of the cell membrane (P-face) and the details of ECM fibril interaction with the cellular membrane and possibly the cellular cytoskeleton. Bar = 500 nm (B) High magnification of cellular cytoskeletal interaction with the cell membrane at locations where the indentations have been disrupted by the fracture plane. The membrane appears to interact with fibrillar molecules, which span the indentation parallel to the cell surface (arrows). Bar = 50 nm. (C) High magnification image of the indentation morphology and its interaction of an ECM fibril. The indentation is spanned by a fibrillar molecule, which appears to be striated (black arrowhead). At the top of the image, an ECM fibril appears to dip into an indentation (white arrow). Bar = 50 nm (D) Striated fibrils in the matrix presumed to be outside the cell (arrow). The fibrils are about 20 nm in diameter and appear to be branched. Bar = 50 nm.
Figure 9
Transmission electron micrograph of collagen and associated fibrillar structures. A collagen fibril (white arrow) is associated with numerous faintly stained microfibrils. These microfibrillar structures could account for the high-density of fine fibrils in the ECM detected by QFDE imaging. Bar = 100 nm. Image is representative of 5 experiments
Figure 10
Indirect immunofluorescence micrographs of collagen in HCF synthesized constructs. (A) Merged type V collagen (red) and DAPI (blue) stained construct. Some areas stained more intensely than others but type V collagen was distributed throughout the extracellular matrix. (B) Merged type VI collagen (amber) and DAPI (blue) stained construct. Type VI collagen was found throughout the tissue but appears more concentrated at the bottom of the construct. Bars = 50 microns.
Similar articles
- Disorganized collagen scaffold interferes with fibroblast mediated deposition of organized extracellular matrix in vitro.
Saeidi N, Guo X, Hutcheon AE, Sander EA, Bale SS, Melotti SA, Zieske JD, Trinkaus-Randall V, Ruberti JW. Saeidi N, et al. Biotechnol Bioeng. 2012 Oct;109(10):2683-98. doi: 10.1002/bit.24533. Epub 2012 May 4. Biotechnol Bioeng. 2012. PMID: 22528405 Free PMC article. - Transplanted corneal stromal cells in vitreous reproduce extracellular matrix of healing corneal stroma.
Komai-Hori Y, Kublin CL, Zhan Q, Cintron C. Komai-Hori Y, et al. Invest Ophthalmol Vis Sci. 1996 Mar;37(4):637-44. Invest Ophthalmol Vis Sci. 1996. PMID: 8595964 - Human corneal fibrillogenesis. Collagen V structural analysis and fibrillar assembly by stromal fibroblasts in culture.
Ruggiero F, Burillon C, Garrone R. Ruggiero F, et al. Invest Ophthalmol Vis Sci. 1996 Aug;37(9):1749-60. Invest Ophthalmol Vis Sci. 1996. PMID: 8759342 - Regulation of corneal stroma extracellular matrix assembly.
Chen S, Mienaltowski MJ, Birk DE. Chen S, et al. Exp Eye Res. 2015 Apr;133:69-80. doi: 10.1016/j.exer.2014.08.001. Exp Eye Res. 2015. PMID: 25819456 Free PMC article. Review. - Composition, structure and function of the corneal stroma.
Espana EM, Birk DE. Espana EM, et al. Exp Eye Res. 2020 Sep;198:108137. doi: 10.1016/j.exer.2020.108137. Epub 2020 Jul 11. Exp Eye Res. 2020. PMID: 32663498 Free PMC article. Review.
Cited by
- A novel 3D culture model of fungal keratitis to explore host-pathogen interactions within the stromal environment.
Brown ME, Montgomery ML, Kamath MM, Nicholas S, Liu Y, Karamichos D, Fuller KK. Brown ME, et al. Exp Eye Res. 2021 Jun;207:108581. doi: 10.1016/j.exer.2021.108581. Epub 2021 Apr 15. Exp Eye Res. 2021. PMID: 33865843 Free PMC article. - Nutritional and Metabolic Imbalance in Keratoconus.
Lasagni Vitar RM, Bonelli F, Rama P, Ferrari G. Lasagni Vitar RM, et al. Nutrients. 2022 Feb 21;14(4):913. doi: 10.3390/nu14040913. Nutrients. 2022. PMID: 35215563 Free PMC article. Review. - Surface topography induces 3D self-orientation of cells and extracellular matrix resulting in improved tissue function.
Guillemette MD, Cui B, Roy E, Gauvin R, Giasson CJ, Esch MB, Carrier P, Deschambeault A, Dumoulin M, Toner M, Germain L, Veres T, Auger FA. Guillemette MD, et al. Integr Biol (Camb). 2009 Feb;1(2):196-204. doi: 10.1039/b820208g. Epub 2009 Jan 15. Integr Biol (Camb). 2009. PMID: 20023803 Free PMC article. - Hypoxia modulates the development of a corneal stromal matrix model.
Lee A, Karamichos D, Onochie OE, Hutcheon AEK, Rich CB, Zieske JD, Trinkaus-Randall V. Lee A, et al. Exp Eye Res. 2018 May;170:127-137. doi: 10.1016/j.exer.2018.02.021. Epub 2018 Feb 27. Exp Eye Res. 2018. PMID: 29496505 Free PMC article. - Extracellular Vesicles Secreted by Corneal Epithelial Cells Promote Myofibroblast Differentiation.
McKay TB, Hutcheon AEK, Zieske JD, Ciolino JB. McKay TB, et al. Cells. 2020 Apr 26;9(5):1080. doi: 10.3390/cells9051080. Cells. 2020. PMID: 32357574 Free PMC article.
References
- Cowin SC. How is a tissue built? J Biomech Eng. 2000;122:553–69. - PubMed
- Cowin SC. Tissue growth and remodeling. Annu Rev Biomed Eng. 2004;6:77–107. - PubMed
- Goldman JN, Benedek GB. The relationship between morphology and transparency in the nonswelling corneal stroma of the shark. Invest Ophthalmol. 1967;6:574–600. - PubMed
- Hart RW, Farrell RA. Light scattering in the cornea. J Opt Soc Am. 1969;59:766–774. - PubMed
Publication types
MeSH terms
Substances
LinkOut - more resources
Full Text Sources
Other Literature Sources
Medical


