Wide-scale analysis of human functional transcription factor binding reveals a strong bias towards the transcription start site - PubMed (original) (raw)
Wide-scale analysis of human functional transcription factor binding reveals a strong bias towards the transcription start site
Yuval Tabach et al. PLoS One. 2007.
Abstract
Background: Transcription factors (TF) regulate expression by binding to specific DNA sequences. A binding event is functional when it affects gene expression. Functionality of a binding site is reflected in conservation of the binding sequence during evolution and in over represented binding in gene groups with coherent biological functions. Functionality is governed by several parameters such as the TF-DNA binding strength, distance of the binding site from the transcription start site (TSS), DNA packing, and more. Understanding how these parameters control functionality of different TFs in different biological contexts is a must for identifying functional TF binding sites and for understanding regulation of transcription.
Methodology/principal findings: We introduce a novel method to screen the promoters of a set of genes with shared biological function (obtained from the functional Gene Ontology (GO) classification) against a precompiled library of motifs, and find those motifs which are statistically over-represented in the gene set. More than 8,000 human (and 23,000 mouse) genes, were assigned to one of 134 GO sets. Their promoters were searched (from 200 bp downstream to 1,000 bp upstream the TSS) for 414 known DNA motifs. We optimized the sequence similarity score threshold, independently for every location window, taking into account nucleotide heterogeneity along the promoters of the target genes. The method, combined with binding sequence and location conservation between human and mouse, identifies with high probability functional binding sites for groups of functionally-related genes. We found many location-sensitive functional binding events and showed that they clustered close to the TSS. Our method and findings were tested experimentally.
Conclusions/significance: We identified reliably functional TF binding sites. This is an essential step towards constructing regulatory networks. The promoter region proximal to the TSS is of central importance for regulation of transcription in human and mouse, just as it is in bacteria and yeast.
Conflict of interest statement
Competing Interests: The authors have declared that no competing interests exist.
Figures
Figure 1. The TATA box score and GC content versus location on the promoters.
A. Each 11bp-long sequence, located in the interval [+200, −1000] bp with respect to the TSS on the promoters of 22,000 human genes, was scored using the PSSM of the TATA box. Scores above −10.4 were identified as hits and marked by a point whose horizontal coordinate represents the location of the hit and the vertical coordinate represents the value of its score. The high density of hits at about 25 and 35bp upstream from the TSS identifies these locations as most likely to be functionally relevant. The 3 colored dotted lines represent 3 different thresholds (T) and the numbers next to each one of them are the % of TATA BS that were found in the location window [−100,TSS]. B. The GC content as a function of location in the interval [+200, −1000] bp with respect to the TSS. The vertical axis represents the percentage of promoters of 22,000 human genes that have a G or a C at each location. Pronounced dips are observed at the TATA box and at the TSS. C. Distribution of identified hits obtained for various values of the threshold, marked by red, green and blue horizontal lines on Fig 1A, with the % of hits found within the proximal peak also given there, for each threshold. As the threshold increases, the overall number of hits decreases, but the relative weight of the proximal peak increases from 8% (for threshold T = −10.6) to 27% (for T = −6.5). D. Our method identified BSs on 55 out of 81 promoters known to have proximal TATA BSs (see text), in the window [TSS, −100], and none in any of the other location windows (red dot). The threshold selected by our method was −10.27; if this threshold is used uniformly in the entire [200, −1000] interval, about 250 hits are found outside the first upstream interval. The black dots denote the number of hits in and outside the first window, with the numbers next to each point indicating the value of the uniform threshold used. The blue point shows the hits found by Xie et al, demonstrating that their conservation-based method is also effective in eliminating false positives, but has a much larger number of false negatives than our method.
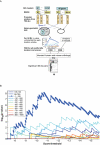
Figure 2. Our method of search for BSs.
A. Schematic method of search: we used groups of human genes that belong to 134 different functional GO classes G, to search for each one of 414 motifs M in twelve 100bp-long windows W in the interval [+200, −1000] bp with respect to the TSS. In total, 414×134×12 = 665,712 independent analyses were carried out, one for every (M,G,W) combination, represented as a path through the top three layers of boxes. Each analysis produced the number of genes of G for which the score of M in the window W exceeded a threshold T. The extent of over-representation of such hits was assessed by the hypergeometric test, which compared their number with similar hits in a random selection of |G| out of all 8,110 human genes used. A variation of the resulting p-values p (M,G,W) with the threshold T was studied. All resulting p-values were submitted to FDR analysis, and the statistically significant (M,G,W) combinations were intersected with those that were found significant also in mouse. B. The dependence of –log[ _p (M,G,W)_] on the score threshold T is shown for 12 windows, for G = Mitosis GO class and M = NFY1. For the window [TSS, −100] bp we get a very prominent peak, for the windows in [−100, −300] bp the peak is much smaller and broader, and for the other windows it is within the noise. We find significant enrichment for the [TSS,−100] window, with the optimal threshold derived from the location of the peak.
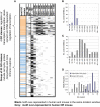
Figure 3. Summary of our main results.
A. Using FDR of 0.1 we identify the over-representation of motif M on promoters of genes of functional GO class G, in location window W. Each row corresponds to one of 333 (M,G) pairs, composed of 56 GO classes and 159 motifs. Each bar represents an MGLC: grey–either human only or mouse only, and black-human and mouse. The 56 GO clusters divide into two groups, a “general GO group” of 52 GO classes and a “transcriptional GO group” of 4 GO classes. The motifs M of the latter are GC-rich–see first column, where orange denotes GC content above 60%, blue–below 30% and white–between both these values. B. Number of conserved MGLCs of the General GO group, in each window. 93% are in the [−200,0] bp range. C. Same for the transcriptional GO group. The distribution is broad and peaks between 300–500bp upstream from the TSS. D. Distributions of BSs according to their GC content, plotted separately for BSs associated with the two GO groups.
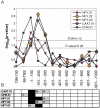
Figure 4. Testing our results for human cell cycle expression data.
A. For 60 groups of genes (each group defined by BS found for one of the 5 cell cycle associated motifs in one of the 12 location windows, see text) the distribution of the expression-based CCP scores was compared to a reference background distribution. The resulting 60 p-values are plotted for the different motifs versus their location window. All 5 motifs get p-values less than 0.05 and also pass at FDR of 0.10. Two windows, [0, −100] and [−100, −200] bp, are most significantly over-represented. B. Significant sequence-based hyper-geometric over-representation scores for each of the motif-window combinations. A grey bar represents a significant score (MGLC) for human or mouse, for at least one of the cell-cycle related GO classes. A black bar stands for an MGLC in both human and mouse.
Figure 5. Direct experimental test of the effect of BS distance from the TSS.
A. A graphic representation of four constructs encoding a luciferase reporter (luc) gene under the regulation of three tandem repeats of a region from the SM22 promoter, each of which contained either an intact (wt in yellow ) or a mutated (m in red) BS of the Myocardin transcription factor. The intact motif is placed at different distances from the TSS in each construct. B. Fold activation of the luciferase construct, calculated as the ratio of promoter activity in the presence of Myocardin to the promoter activity in the absence of Myocardin. The “m-m-wt-luc” reporter was strongly activated by Myocardin. In contrast, the Myocardin-dependent activation of “m-wt-m-luc” and “wt-m-m-luc” was significantly weaker.
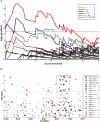
Figure 6. Testing our method on ATM-induced expression data.
A. Analysis of G = 138 ATM-dependent genes for M = NF-kB.01 over representation. The dependence of –log[ _p (M,G,W)_] on the score threshold T is shown for 23 overlapping windows. Three upstream windows, (TSS- 100), (50–150) and (100–200) passed the hypergeometric test at an FDR of 10%. B. putative NF-kB.01 BSs of the 138 ATM-dependent genes; score (vertical axis) versus location (horizontal axis). Our algorithm identifies the location and scores that are indicative of functionality of the BS (rectangle enclosed by the red dashed line). Solid colored symbols mark genes whose expression was validated by PCR. The other genes in the box are marked with blank colored symbols, those that are likely targets of NF-kB outside the box–by X. We list next to the gene names the fold change as measured by the microarray and by PCR (in parentheses). The black dots are belong to the rest of the 138 genes,with putative BS outside the area indicative of functionality.
Similar articles
- Most of the tight positional conservation of transcription factor binding sites near the transcription start site reflects their co-localization within regulatory modules.
Acevedo-Luna N, Mariño-Ramírez L, Halbert A, Hansen U, Landsman D, Spouge JL. Acevedo-Luna N, et al. BMC Bioinformatics. 2016 Nov 21;17(1):479. doi: 10.1186/s12859-016-1354-5. BMC Bioinformatics. 2016. PMID: 27871221 Free PMC article. - MicroRNA promoter element discovery in Arabidopsis.
Megraw M, Baev V, Rusinov V, Jensen ST, Kalantidis K, Hatzigeorgiou AG. Megraw M, et al. RNA. 2006 Sep;12(9):1612-9. doi: 10.1261/rna.130506. Epub 2006 Aug 3. RNA. 2006. PMID: 16888323 Free PMC article. - Identification of highly specific localized sequence motifs in human ribosomal protein gene promoters.
Roepcke S, Zhi D, Vingron M, Arndt PF. Roepcke S, et al. Gene. 2006 Jan 3;365:48-56. doi: 10.1016/j.gene.2005.09.033. Epub 2005 Dec 15. Gene. 2006. PMID: 16343812 - Transcription from TATA-less promoters: dihydrofolate reductase as a model.
Azizkhan JC, Jensen DE, Pierce AJ, Wade M. Azizkhan JC, et al. Crit Rev Eukaryot Gene Expr. 1993;3(4):229-54. Crit Rev Eukaryot Gene Expr. 1993. PMID: 8286846 Review. - Biological functions of the duplicated GGAA-motifs in various human promoter regions.
Uchiumi F, Miyazaki S, Tanuma S. Uchiumi F, et al. Yakugaku Zasshi. 2011;131(12):1787-800. doi: 10.1248/yakushi.131.1787. Yakugaku Zasshi. 2011. PMID: 22129877 Review.
Cited by
- A dynamic network of transcription in LPS-treated human subjects.
Seok J, Xiao W, Moldawer LL, Davis RW, Covert MW. Seok J, et al. BMC Syst Biol. 2009 Jul 28;3:78. doi: 10.1186/1752-0509-3-78. BMC Syst Biol. 2009. PMID: 19638230 Free PMC article. - MEPP: more transparent motif enrichment by profiling positional correlations.
Delos Santos NP, Duttke S, Heinz S, Benner C. Delos Santos NP, et al. NAR Genom Bioinform. 2022 Oct 17;4(4):lqac075. doi: 10.1093/nargab/lqac075. eCollection 2022 Dec. NAR Genom Bioinform. 2022. PMID: 36267125 Free PMC article. - Gene promoter evolution targets the center of the human protein interaction network.
Planas J, Serrat JM. Planas J, et al. PLoS One. 2010 Jul 8;5(7):e11476. doi: 10.1371/journal.pone.0011476. PLoS One. 2010. PMID: 20628608 Free PMC article. - A regulatory similarity measure using the location information of transcription factor binding sites in Saccharomyces cerevisiae.
Wu WS, Wei ML, Yeh CM, Chang DT. Wu WS, et al. BMC Syst Biol. 2014;8 Suppl 5(Suppl 5):S9. doi: 10.1186/1752-0509-8-S5-S9. Epub 2014 Dec 12. BMC Syst Biol. 2014. PMID: 25560196 Free PMC article. - Algorithm to identify frequent coupled modules from two-layered network series: application to study transcription and splicing coupling.
Li W, Dai C, Liu CC, Zhou XJ. Li W, et al. J Comput Biol. 2012 Jun;19(6):710-30. doi: 10.1089/cmb.2012.0025. J Comput Biol. 2012. PMID: 22697243 Free PMC article.
References
- Elnitski L, Jin VX, Farnham PJ, Jones SJ. Locating mammalian transcription factor binding sites: a survey of computational and experimental techniques. Genome Res. 2006;16:1455–1464. - PubMed
- Allison DB, Cui X, Page GP, Sabripour M. Microarray data analysis: from disarray to consolidation and consensus. Nat Rev Genet. 2006;7:55–65. - PubMed
Publication types
MeSH terms
Substances
LinkOut - more resources
Full Text Sources
Miscellaneous


