Pcl-PRC2 is needed to generate high levels of H3-K27 trimethylation at Polycomb target genes - PubMed (original) (raw)
Pcl-PRC2 is needed to generate high levels of H3-K27 trimethylation at Polycomb target genes
Maxim Nekrasov et al. EMBO J. 2007.
Abstract
PRC2 is thought to be the histone methyltransferase (HMTase) responsible for H3-K27 trimethylation at Polycomb target genes. Here we report the biochemical purification and characterization of a distinct form of Drosophila PRC2 that contains the Polycomb group protein polycomblike (Pcl). Like PRC2, Pcl-PRC2 is an H3-K27-specific HMTase that mono-, di- and trimethylates H3-K27 in nucleosomes in vitro. Analysis of Drosophila mutants that lack Pcl unexpectedly reveals that Pcl-PRC2 is required to generate high levels of H3-K27 trimethylation at Polycomb target genes but is dispensable for the genome-wide H3-K27 mono- and dimethylation that is generated by PRC2. In Pcl mutants, Polycomb target genes become derepressed even though H3-K27 trimethylation at these genes is only reduced and not abolished, and even though targeting of the Polycomb protein complexes PhoRC and PRC1 to Polycomb response elements is not affected. Pcl-PRC2 is thus the HMTase that generates the high levels of H3-K27 trimethylation in Polycomb target genes that are needed to maintain a Polycomb-repressed chromatin state.
Figures
Figure 1
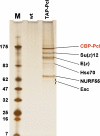
TAP of Pcl protein complexes from Drosophila embryonic nuclear extracts. Protein complexes purified from wild-type (wt) and TAP-Pcl; Pcl+/+ embryos. Purified material was separated on a 4–12% polyacrylamide gel and visualized by silver staining; ‘M' indicates molecular weight marker. Input material for mock purification from wild-type embryos, and for purification from transgenic embryos was normalized by protein concentration and equivalent amounts of material eluted from calmodulin affinity resin was loaded. Complexes were eluted with EGTA under non-denaturing conditions. Approximately 0.67 pmol of Pcl–PRC2 complex is loaded, this amount was determined by comparing with mass spectrometry analysis of defined amounts of purified recombinant Pcl, E(z) and Su(z)12 (not shown, see Figure 3). Indicated proteins consistently co-purified with CBP-Pcl in several independent experiments and were identified by microsequencing; CBP in fusion proteins refers to the calmodulin-binding moiety of the TAP-tag. Note presence of PRC2 subunits Su(z)12, E(z), NURF55 and Esc in TAP-Pcl lane; Esc stains poorly and runs as a diffuse band, but is identified by multiple peptides like the other proteins (Supplementary Figure S1). See Supplementary Figure S1 for information on additional proteins identified by mass spectrometry.
Figure 2
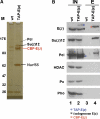
TAP of E(z) protein complexes from Drosophila embryonic nuclear extracts. (A) Protein complexes purified from wild-type (wt) and TAP-E(z); E(z)+/+ embryos. Purified material was separated on a 4–12% polyacrylamide gel and visualized by silver staining. Input material for mock purification from wild-type embryos and for purification from transgenic embryos was normalized by protein concentration and equivalent amounts of material eluted from calmodulin affinity resin was loaded; complexes were eluted by boiling of calmodulin resin in SDS buffer. Indicated proteins consistently co-purified with CBP-E(z) in several independent experiments and were identified by microsequencing; CBP in fusion proteins refers to the calmodulin-binding moiety of the TAP-tag. PRC2 subunits Su(z)12, Nurf55 and the weak Pcl band in TAP-E(z) lane were all identified by multiple peptides (Supplementary Figure S1) in excised gel bands; Esc was not detected on the gel. See Supplementary Figure S1 for information on additional proteins identified by mass spectrometry. (B) Western blot analysis of total embryonic nuclear extract input material (IN, lanes 1 and 2) from wild-type (wt) and TAP-E(z) transgenic embryos, and material eluted from calmodulin affinity resin (E, lanes 3 and 4) after purification. All panels come from the same batch of input material, and eluates were all from the same batch of material purified from wild-type and TAP-E(z) embryos, respectively; the same ratio of input versus eluate material was loaded in all cases. CBP-E(z) (red asterisk), TAP-E(z) (blue asterisk) and endogenous E(z) (black asterisk) are indicated; in lane 2, TAP-E(z) is also detected by other antibodies due to protein A tag. Compare the relative enrichment of E(z), Su(z)12 and Pcl in lane 4. For unknown reasons, Su(z)12 and Pcl in lane 4 migrate with slightly higher mobility. Note the lack of signals for HDAC, Pc and Pho in lane 4.
Figure 3
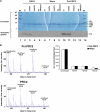
HMTase activity of Pcl-PRC2 and PRC2 in vitro. (A) Molecular weight marker (lanes 1 and 14) and HMTase reactions (lanes 2–13) performed with 2 pmol recombinant PRC2 (lanes 2–5), no complex (‘mock', lanes 6–9) or 0.67 pmol Pcl-PRC2 (lanes 10–13), [14C]-SAM (lanes 2–13) and 2.8 pmol wild-type (wt) or mutant (H3-K9A, H3K27A and H3-K9A/K27A) mononucleosomes as indicated, were resolved on a 20% SDS–polyacrylamide gel. The gel was stained with Coomassie (top) and exposed for autoradiography (below). Note that Pcl-PRC2 and PRC2 both specifically methylate H3-K27 (compare lanes 2–5 with 10–13), no methylation is observed on nucleosomes with H3 containing the K27A mutation. (B) Mass spectrometry analysis of H3 following HMTase reactions with Pcl-PRC2 (top) or PRC2 (bottom). HMTase reactions were performed as in lanes 2 and 10 in panel A except that non-radioactive SAM was used and reactions were allowed to proceed for 12 h; excised H3 bands were digested and analyzed by reverse-phase chromatography and quantitative mass spectrometry. Chromatography separated modified and unmodified H3KSAPATGGVK peptides by only ∼95 s. Therefore a single mass spectrum can show ions of unmodified and all methylation states of H3KSAPATGGVK peptides during their elution. The right lane shows the ion volumes (thompson*sec) of unmodified and modified H3KSAPATGGVK peptides after HMTase reaction. The ion volume is the summed ion intensity of a peptide over its elution time (Fraterman et al, 2007). Note that Pcl-PRC2 and PRC2 generate comparable ion volumes of mono-, di- and trimethylated H3-K27 in this assay. The error bars indicate the standard deviation of a duplicate analysis.
Figure 4
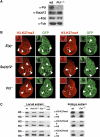
Pcl is needed for high levels of H3-K27 trimethylation in Drosophila. (A) Western blot analysis of extracts from 16- to 18-h-old wild-type (wt) and Pcl 22M21 homozygous (_Pcl_−/−) embryos, probed with antibodies against the indicated proteins; the anti-tubulin (a-Tub) Western blot provides control for loading of equal amounts of extract. Note that in _Pcl_−/− embryos, no Pcl protein is detected, but that Su(z)12 and E(z) protein levels are comparable to wt embryos. (B) Wing imaginal discs with clones of cells that are homozygous for E(z) 731 (E(z)), Su(z)12 4 (Su(z)12), or Pcl 21M22 (Pcl), stained with antibodies against H3-K27me3 (red signal, left column) or H3-K27me1 (red signal, right column). In each case, clones of mutant cells are marked by the absence of GFP signal (green) and discs were analyzed 96 h after clone induction. Su(z)12 and E(z) mutant clones show complete loss of H3-K27me3 and H3-K27me1 signals (arrowheads). Pcl mutant clones also show a clear reduction of H3-K27me3 levels (arrowheads), but H3-K27me1 levels are unaffected (empty arrowheads) and are comparable to those in neighboring wild-type cells. Representative clones (white frame) are shown at higher magnification (C) Western blot analysis of extracts from imaginal disc and CNS tissues from second instar larvae (larval extract, left column) or from 16- to 18-h-old embryos (embryo extract, right column) of the following genotypes: wild-type (wt), Su(z)12 4 /Su(z)12 4 (_Su(z)12_−/−), E(z) 731 /E(z) 731 (_E(z)_−/−), Pcl 22M21 /Pcl 22M21 (_Pcl_−/−). Recombinant histone octamer (rec. oct.) reconstituted from Xenopus histones expressed in Escherichia coli served as additional control for H3-K27me antibody specificity. In each case, the membrane was simultaneously probed with the antibody against the indicated H3-K27 methylation state and with an antibody against unmodified histone H4, to control for equal extract loading and Western blot processing. Note that in _E(z)_−/− and _Su(z)12_−/− larvae, H3-K27me3 Western blot signals are comparable to those observed in wt larvae and only H3-K27me1 and H3-K27me2 signals are detectably reduced. In _Pcl_−/− embryos, H3-K27me1, H3-K27me2 and H3-K27me3 Western blot signals are comparable to those observed in wt embryos.
Figure 5
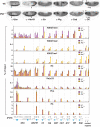
Pcl is required for repression and H3-K27 trimethylation at PcG target genes. (Top) Wild-type (wt, top row) and Pcl 22M21 homozygous (_Pcl_−/−, bottom row) embryos stained with antibodies against Ubx, Abd-B, Engrailed (En), Wingless (Wg), Caudal (Cad) and Distal-less (Dll) proteins. In _Pcl_−/− embryos, Ubx and Abd-B are misexpressed outside of their normal expression domains; arrowheads mark anterior margin of ps5 and ps10 that correspond to the anterior boundary of the Ubx and Abd-B expression domain in wt animals, respectively. Expression of En is essentially normal in _Pcl_−/− animals and only very few En-positive cells that are not visible here are present in addition to the wild-type En expression pattern in the posterior compartment of every segment (cf. Moazed and O'Farrell, 1992). The complex expression pattern of Wg, expression of Cad at the posterior end of the embryo (arrowhead) and Dll expression in the head and thorax (arrowheads) are all normal in _Pcl_−/− animals and no misexpression is detected. The slightly reduced levels of Dll expression in the imaginal disc primordia in thoracic segments (arrowheads) in _Pcl_−/− animals is likely due to downregulation by misexpressed BX-C proteins (Vachon et al, 1992). (Bottom). X-ChIP analysis in wild-type (wt, purple bars) and Pcl mutant (_Pcl_−/−, yellow bars) embryos, respectively. Each bar shows the result from at least three independent immunoprecipitation reactions on independently prepared batches of chromatin, performed with the indicated antibodies against H3-K27me3, H3-K27me2, H3-K27me1, unmodified H3, Su(z)12, Pho or Ph; X-ChIP signal levels are presented as percentage of input chromatin precipitated for each region. The location of PREs (blue boxes) and other regions with respect to the transcription start sites are indicated in kilobases, see Supplementary Figure S4 for information on exact location of PCR primer pairs. Note that at each region, H3 X-ChIP signals are comparably high in wt and Pcl mutant embryos. The comparably lower H3-X-ChIP signal at each PREs in both wt and Pcl mutant embryos suggests inefficient detection of nucleosomes or, more likely, reduced nucleosome occupancy at PREs, as previously observed at Ubx (Kahn et al, 2006; Mohd-Sarip et al, 2006; Papp and Müller, 2006). In wt animals, H3-K27me3 X-ChIP signals are enriched at all target genes compared to control regions 1 and 2. Note that in Pcl mutant embryos, H3-K27me3 signals are at least two-fold lower in each region; only at Dll, H3-K27me3 signals are unaltered. In wild-type embryos, H3-K27me1 and H3-K27me2 signals at target genes are overall lower than in control regions 1 and 2. Note that in Pcl mutants H3-K27me1 and H3-K27me2 signals are strongly increased at target genes and that they are also increased at control regions 1 and 2 (see text for details). Note the specific enrichment of Su(z)12, Pho and Ph at PREs. In Pcl mutant embryos, binding of Pho and Ph is undiminished compared to wild-type embryos but Su(z)12 binding is reduced. Note that Su(z)12 X-ChIP signals at the bxd PRE in Pcl mutants are still higher than in control regions 1 and 2. Compared to X-ChIP assays in imaginal discs (Papp and Müller, 2006), we find that in embryos a smaller fraction of input material is precipitated with Pho, Ph and, in particular, with Su(z)12 antibodies. It is possible that the intrinsically different fixation procedure is responsible for a lower crosslinking efficiency in embryos compared with discs. Asterisks (*) indicate regions where X-ChIP signals were not measured.
Similar articles
- Histone trimethylation and the maintenance of transcriptional ON and OFF states by trxG and PcG proteins.
Papp B, Müller J. Papp B, et al. Genes Dev. 2006 Aug 1;20(15):2041-54. doi: 10.1101/gad.388706. Genes Dev. 2006. PMID: 16882982 Free PMC article. - The N terminus of Drosophila ESC binds directly to histone H3 and is required for E(Z)-dependent trimethylation of H3 lysine 27.
Tie F, Stratton CA, Kurzhals RL, Harte PJ. Tie F, et al. Mol Cell Biol. 2007 Mar;27(6):2014-26. doi: 10.1128/MCB.01822-06. Epub 2007 Jan 8. Mol Cell Biol. 2007. PMID: 17210640 Free PMC article. - A Role for Monomethylation of Histone H3-K27 in Gene Activity in Drosophila.
Wang L, Joshi P, Miller EL, Higgins L, Slattery M, Simon JA. Wang L, et al. Genetics. 2018 Mar;208(3):1023-1036. doi: 10.1534/genetics.117.300585. Epub 2017 Dec 14. Genetics. 2018. PMID: 29242288 Free PMC article. - Inner workings and regulatory inputs that control Polycomb repressive complex 2.
O'Meara MM, Simon JA. O'Meara MM, et al. Chromosoma. 2012 Jun;121(3):221-34. doi: 10.1007/s00412-012-0361-1. Epub 2012 Feb 19. Chromosoma. 2012. PMID: 22349693 Free PMC article. Review. - The Polycomb complex PRC2 and its mark in life.
Margueron R, Reinberg D. Margueron R, et al. Nature. 2011 Jan 20;469(7330):343-9. doi: 10.1038/nature09784. Nature. 2011. PMID: 21248841 Free PMC article. Review.
Cited by
- Uncoupled evolution of the Polycomb system and deep origin of non-canonical PRC1.
de Potter B, Raas MWD, Seidl MF, Verrijzer CP, Snel B. de Potter B, et al. Commun Biol. 2023 Nov 10;6(1):1144. doi: 10.1038/s42003-023-05501-x. Commun Biol. 2023. PMID: 37949928 Free PMC article. - Polycomb and trithorax opposition in development and disease.
Poynter ST, Kadoch C. Poynter ST, et al. Wiley Interdiscip Rev Dev Biol. 2016 Nov;5(6):659-688. doi: 10.1002/wdev.244. Epub 2016 Sep 1. Wiley Interdiscip Rev Dev Biol. 2016. PMID: 27581385 Free PMC article. Review. - Polycomb Repressive Complex 2 and Trithorax modulate Drosophila longevity and stress resistance.
Siebold AP, Banerjee R, Tie F, Kiss DL, Moskowitz J, Harte PJ. Siebold AP, et al. Proc Natl Acad Sci U S A. 2010 Jan 5;107(1):169-74. doi: 10.1073/pnas.0907739107. Epub 2009 Dec 14. Proc Natl Acad Sci U S A. 2010. PMID: 20018689 Free PMC article. - Spps, a Drosophila Sp1/KLF family member, binds to PREs and is required for PRE activity late in development.
Brown JL, Kassis JA. Brown JL, et al. Development. 2010 Aug 1;137(15):2597-602. doi: 10.1242/dev.047761. Development. 2010. PMID: 20627963 Free PMC article. - Polycomb-like 2 associates with PRC2 and regulates transcriptional networks during mouse embryonic stem cell self-renewal and differentiation.
Walker E, Chang WY, Hunkapiller J, Cagney G, Garcha K, Torchia J, Krogan NJ, Reiter JF, Stanford WL. Walker E, et al. Cell Stem Cell. 2010 Feb 5;6(2):153-66. doi: 10.1016/j.stem.2009.12.014. Cell Stem Cell. 2010. PMID: 20144788 Free PMC article.
References
- Beuchle D, Struhl G, Müller J (2001) Polycomb group proteins and heritable silencing of Drosophila Hox genes. Development 128: 993–1004 - PubMed
- Birve A, Sengupta A, Beuchle D, Larsson J, Kennison J, Rasmuson-Lestander A, Müller J (2001) Su(z)12, a novel Drosophila Polycomb group gene that is conserved in vertebrates and plants. Development 128: 3371–3379 - PubMed
- Boyer L, Plath K, Zeitlinger J, Brambrink T, Medeiros L, Lee T, Levine S, Wernig M, Tajonar A, Ray M, Bell G, Otte A, Vidal M, Gifford D, Young R, Jaenisch R (2006) Polycomb complexes repress developmental regulators in murine embryonic stem cells. Nature 441: 349–353 - PubMed
- Breen TR, Duncan IM (1986) Maternal expression of genes that regulate the bithorax complex of Drosophila melanogaster. Dev Biol 118: 442–456 - PubMed
- Brock HW, Fisher CL (2005) Maintenance of gene expression patterns. Dev Dyn 232: 633–655 - PubMed
Publication types
MeSH terms
Substances
LinkOut - more resources
Full Text Sources
Other Literature Sources
Molecular Biology Databases
