Progressive loss of CD3 expression after HTLV-I infection results from chromatin remodeling affecting all the CD3 genes and persists despite early viral genes silencing - PubMed (original) (raw)
Progressive loss of CD3 expression after HTLV-I infection results from chromatin remodeling affecting all the CD3 genes and persists despite early viral genes silencing
Haidar Akl et al. Virol J. 2007.
Abstract
Background: HTLV-I infected CD4+ T-cells lines usually progress towards a CD3- or CD3low phenotype. In this paper, we studied expression, kinetics, chromatin remodeling of the CD3 gene at different time-points post HTLV-I infection.
Results: The onset of this phenomenon coincided with a decrease of CD3gamma followed by the subsequent progressive reduction in CD3delta, then CD3epsilon and CD3zeta mRNA. Transient transfection experiments showed that the CD3gamma promoter was still active in CD3- HTLV-I infected cells demonstrating that adequate amounts of the required transcription factors were available. We next looked at whether epigenetic mechanisms could be responsible for this progressive decrease in CD3 expression using DNase I hypersensitivity (DHS) experiments examining the CD3gamma and CD3delta promoters and the CD3delta enhancer. In uninfected and cells immediately post-infection all three DHS sites were open, then the CD3gamma promoter became non accessible, and this was followed by a sequential closure of all the DHS sites corresponding to all three transcriptional control regions. Furthermore, a continuous decrease of in vivo bound transcription initiation factors to the CD3gamma promoter was observed after silencing of the viral genome. Coincidently, cells with a lower expression of CD3 grew more rapidly.
Conclusion: We conclude that HTLV-I infection initiates a process leading to a complete loss of CD3 membrane expression by an epigenetic mechanism which continues along time, despite an early silencing of the viral genome. Whether CD3 progressive loss is an epiphenomenon or a causal event in the process of eventual malignant transformation remains to be investigated.
Figures
Figure 1
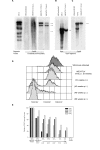
Proviral integration, CD3 surface expression and relative CD3 gene expression over time after HTLV-I infection of WE17/10 cells. A, HTLV-I proviral genome analyses of WE/HTLV cell line by Southern blot. the complete provirus probe was hybridized to the WE/HTLV (at 3 weeks, 4 and 7 months p.i.) genomic DNA digested with E_co_RI. B, the K_pn_I fragment probe was hybridized to the (at 7 months p.i.) genomic DNA digested with S_ac_I. C, the K_pn_I fragment probe was hybridized to the (at 7 months p.i.) genomic DNA digested with E_co_RI. MT-2 and uninfected WE17/10 cell lines were used as positive and negative control respectively. D, TCR/CD3 surface expression over time after HTLV-I infection of WE17/10 cells. profiles showing the distribution of immunofluorescence from anti-CD3 antibody staining in a parallel antibody labeling experiment. Uninfected and HTLV-I infected cells were thawed from the frozen cell line bank at 5, 10, 40, 48, and 58 weeks p.i. TCR/CD3low cells are identified as cells that fall below the minimum fluorescence intensity defined by the positive control but do not lie within the region defined by the negative control. TCR/CD3hi cells fall within the region defined by mock-infected cells, and TCR/CD3- cells fall within the region designated by the negative control. E, Histograms representation of relative CD3 gene expression in HTLV-I infected cells at various times p.i. determined by real time RT-PCR in relation to the percentage of surface TCR/CD3+ cells determined by flow cytometry. All percentages were calculated relative to uninfected cells (100% positive). GM-607 B cell line was used as a negative control.
Figure 2
Functional analysis by transfection of the _CD3_γ promoter activity in HTLV-I infected and uninfected cells. Luciferase activity was measured in uninfected CD3γ+δ+, HTLV-I-infected CD3γ-δ+ and CD3γ-δ- WE17/10 cells after 40 h and normalized to activity from the internal Renilla control. Expression of the wild-type _CD3_γpromoter constructs (pH γ3-wt) was measured in comparison to the negative control basic vector: (pGL3-BV) set to one. The pGL3 promoter vector (pGL3-PV) was used as a positive control. The results represent at least three individual experiments, each performed in triplicate.
Figure 3
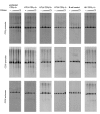
DNase I hypersensitivity of _CD3_γ and _CD3_δ genes regulatory regions after HTLV-I infection. DNase I hypersensitivity experiments using probes designed to specifically detect the _CD3_γ promoter, _CD3_δ promoter or _CD3_δ enhancer, indicated on the Y axis. DNA was digested with increasing concentrations of DNase I (increasing from left to right in each panel) and extracted from uninfected CD3γ+δ+ cells and HTLV-I CD3γ+δ+, CD3γloδ+, and CD3γ-δ- cells. The B cell (CD3 negative) and HIV-1 CD3γ-δ+ cell lines were used as controls. The various cell lines are indicated on the X axis. The level of surface TCR/CD3 expression and relative CD3 gene transcripts for each cell line is shown in Table I.
Figure 4
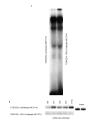
Transcription factor accessibility to the _CD3_γ promoter after HTLV-I infection. A,In vitro binding to the Spγ1/CD3γInr [22] wild-type probe was examined in EMSA assay using nuclear extracts from TCR/CD3+ uninfected WE17/10 and CD3γ-δ- HTLV-I infected WE17/10 cells. B, ChIP assay using anti-Sp1, anti-Sp2, anti-Sp3, anti-TFIID, to study the in vivo binding to the sequence surrounding the Spγ1/CD3γInr motif in TCR/CD3+uninfected and in CD3γ-δ- HTLV-I infected WE17/10 cells.
Figure 5
TSA/AZA treatment of HTLV-I infected WE17/10 cells. A, Representative ethidium bromide-stained gels of _CD3_γ, _CD3_δ and GAPDH (endogenous control) RT-PCR products from untreated HTLV-I infected CD3γ-δlo, TSA/AZA HTLV-I infected CD3γ-δlo (treated for 72 hours with 4 μM of 5'AZA and for 18 hours with 500 nM of TSA) and uninfected untreated WE17/10 cells. B, ChIP assay using anti-Ac-H4 and anti-HDAC to study the in vivo binding to the sequence surrounding the Spγ1/CD3γInr motif in TXP/XΔ3+ uninfected and in untreated and TSA/AZA treated CD3γ-δlo HTLV-I infected WE17/10 cells.
Similar articles
- Silencing of human T-cell leukemia virus type I gene transcription by epigenetic mechanisms.
Taniguchi Y, Nosaka K, Yasunaga J, Maeda M, Mueller N, Okayama A, Matsuoka M. Taniguchi Y, et al. Retrovirology. 2005 Oct 22;2:64. doi: 10.1186/1742-4690-2-64. Retrovirology. 2005. PMID: 16242045 Free PMC article. - Defective CD3gamma gene transcription is associated with NFATc2 overexpression in the lymphocytic variant of hypereosinophilic syndrome.
Willard-Gallo KE, Badran BM, Ravoet M, Zerghe A, Burny A, Martiat P, Goldman M, Roufosse F, Sibille C. Willard-Gallo KE, et al. Exp Hematol. 2005 Oct;33(10):1147-59. doi: 10.1016/j.exphem.2005.06.027. Exp Hematol. 2005. PMID: 16219537 - A change in CD3γ, CD3δ, CD3ϵ, and CD3ζ gene expression in T-lymphocytes from benzene-exposed and benzene-poisoned workers.
Li B, Niu Y, Liu S, Yu W, Chen J, Wu L, Liu W, Chen S, Yang L, Li Y. Li B, et al. J Immunotoxicol. 2012 Apr-Jun;9(2):160-7. doi: 10.3109/1547691X.2011.642022. Epub 2012 Jan 4. J Immunotoxicol. 2012. PMID: 22214187 - Epigenetic dysregulation of the host cell genome in Epstein-Barr virus-associated neoplasia.
Niller HH, Wolf H, Minarovits J. Niller HH, et al. Semin Cancer Biol. 2009 Jun;19(3):158-64. doi: 10.1016/j.semcancer.2009.02.012. Epub 2009 Feb 24. Semin Cancer Biol. 2009. PMID: 19429479 Review. - Deregulation of calcium fluxes in HTLV-I infected CD4-positive T-cells plays a major role in malignant transformation.
Akl H, Badran B, El Zein N, Dobirta G, Burny A, Martiat P. Akl H, et al. Front Biosci (Landmark Ed). 2009 Jan 1;14(10):3925-34. doi: 10.2741/3501. Front Biosci (Landmark Ed). 2009. PMID: 19273323 Review.
Cited by
- HDAC inhibition prevents transgene expression downregulation and loss-of-function in T-cell-receptor-transduced T cells.
Moore TV, Scurti GM, DeJong M, Wang SY, Dalheim AV, Wagner CR, Hutchens KA, Speiser JJ, Godellas CV, Fountain C, Fleser J, Moudgil T, Thomas M, Murray D, Curti BD, Clark JI, Fox BA, Nishimura MI. Moore TV, et al. Mol Ther Oncolytics. 2021 Jan 26;20:352-363. doi: 10.1016/j.omto.2021.01.014. eCollection 2021 Mar 26. Mol Ther Oncolytics. 2021. PMID: 33614916 Free PMC article. - Single-cell mass cytometry analysis of human tonsil T cell remodeling by varicella zoster virus.
Sen N, Mukherjee G, Sen A, Bendall SC, Sung P, Nolan GP, Arvin AM. Sen N, et al. Cell Rep. 2014 Jul 24;8(2):633-45. doi: 10.1016/j.celrep.2014.06.024. Epub 2014 Jul 17. Cell Rep. 2014. PMID: 25043183 Free PMC article. - T-Cell Receptor/CD3 Downregulation and Impaired Signaling in HTLV-1-Infected CD4+ T Cells of HAM Patients.
Nozuma S, Matsuzaki T, Tanaka M, Kodama D, Dozono M, Yoshida T, Takashima H, Kubota R. Nozuma S, et al. Int J Mol Sci. 2025 Feb 17;26(4):1706. doi: 10.3390/ijms26041706. Int J Mol Sci. 2025. PMID: 40004169 Free PMC article. - A transcription factor map as revealed by a genome-wide gene expression analysis of whole-blood mRNA transcriptome in multiple sclerosis.
Riveros C, Mellor D, Gandhi KS, McKay FC, Cox MB, Berretta R, Vaezpour SY, Inostroza-Ponta M, Broadley SA, Heard RN, Vucic S, Stewart GJ, Williams DW, Scott RJ, Lechner-Scott J, Booth DR, Moscato P; ANZgene Multiple Sclerosis Genetics Consortium. Riveros C, et al. PLoS One. 2010 Dec 1;5(12):e14176. doi: 10.1371/journal.pone.0014176. PLoS One. 2010. PMID: 21152067 Free PMC article. - Characteristics of Adult T-Cell Leukemia/Lymphoma Patients with Long Survival: Prognostic Significance of Skin Lesions and Possible Beneficial Role of Valproic Acid.
Yves P, Stephane M, Rishika B, Christine D, Gérard P. Yves P, et al. Leuk Res Treatment. 2015;2015:476805. doi: 10.1155/2015/476805. Epub 2015 Jun 14. Leuk Res Treatment. 2015. PMID: 26199759 Free PMC article.
References
- Lamsoul I, Lodewick J, Lebrun S, Brasseur R, Burny A, Gaynor RB, Bex F. Exclusive ubiquitination and sumoylation on overlapping lysine residues mediate NF-kappaB activation by the human T-cell leukemia virus tax oncoprotein. Mol Cell Biol. 2005;25:10391–10406. doi: 10.1128/MCB.25.23.10391-10406.2005. - DOI - PMC - PubMed
- Nasr R, Chiari E, El-Sabban M, Mahieux R, Kfoury Y, Abdulhay M, Yazbeck V, Hermine O, de Thé H, Pique C, Bazarbachi A. Tax ubiquitylation and sumoylation control critical cytoplasmic and nuclear steps of NF-kappaB activation. Blood. 2006;107:4021–4029. doi: 10.1182/blood-2005-09-3572. - DOI - PubMed
Publication types
MeSH terms
Substances
LinkOut - more resources
Full Text Sources
Research Materials


