Disrupted-In-Schizophrenia 1 regulates integration of newly generated neurons in the adult brain - PubMed (original) (raw)
. 2007 Sep 21;130(6):1146-58.
doi: 10.1016/j.cell.2007.07.010. Epub 2007 Sep 6.
Jay H Chang, Shaoyu Ge, Regina L Faulkner, Ju Young Kim, Yasuji Kitabatake, Xiao-bo Liu, Chih-Hao Yang, J Dedrick Jordan, Dengke K Ma, Cindy Y Liu, Sundar Ganesan, Hwai-Jong Cheng, Guo-li Ming, Bai Lu, Hongjun Song
Affiliations
- PMID: 17825401
- PMCID: PMC2002573
- DOI: 10.1016/j.cell.2007.07.010
Disrupted-In-Schizophrenia 1 regulates integration of newly generated neurons in the adult brain
Xin Duan et al. Cell. 2007.
Abstract
Adult neurogenesis occurs throughout life in discrete regions of the adult mammalian brain. Little is known about the mechanism governing the sequential developmental process that leads to integration of new neurons from adult neural stem cells into the existing circuitry. Here, we investigated roles of Disrupted-In-Schizophrenia 1 (DISC1), a schizophrenia susceptibility gene, in adult hippocampal neurogenesis. Unexpectedly, downregulation of DISC1 leads to accelerated neuronal integration, resulting in aberrant morphological development and mispositioning of new dentate granule cells in a cell-autonomous fashion. Functionally, newborn neurons with DISC1 knockdown exhibit enhanced excitability and accelerated dendritic development and synapse formation. Furthermore, DISC1 cooperates with its binding partner NDEL1 in regulating adult neurogenesis. Taken together, our study identifies DISC1 as a key regulator that orchestrates the tempo of functional neuronal integration in the adult brain and demonstrates essential roles of a susceptibility gene for major mental illness in neuronal development, including adult neurogenesis.
Figures
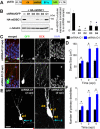
Figure 1.. DISC1 regulates morphogenesis of adult-born neurons.
(A) A schematic diagram of the retroviral vector (pUEG) used for in vivo birth-dating and genetic manipulation. (B) Validation of the efficacy of mDISC1-shRNAs in vitro. Retroviral constructs expressing different shRNAs were co-transfected with an expression construct for HA-tagged mDISC1 into 293 cells and equal amount of cell lysate samples were subjected to Western Blot analysis for HA and α-tubulin. A sample blot is shown on the left. Densitometry quantification is shown on the right. For each experiment, the densitometry measurement of DISC1 band was first normalized to that of α-tubulin and then normalized to no shRNA expression sample. Values represent mean ± SD (n = 3; *: p < 0.01, ANOVA). (C, D) Soma size of adult-born neurons. Shown in (C) are sample confocal images of GFP, DAPI and immunostaining for DCX. Scale bar: 10 μm. Shown in (D) is the summary of soma area of GFP+ neurons at 1, 2 and 4 wpi. Values represent mean ± SEM (n = 4 animals; *: p < 0.05, ANOVA). (E, F) Primary dendrites of adult-born neurons. Shown in (E) are sample projections of Z-series confocal images of GFP+ neurons at 2 wpi. Arrows and arrowheads point to initiation sites of axons (a) and primary dendrites (d), respectively. Scale bar: 10 μm. Shown in (F) is summary of primary dendrite numbers of GFP+ neurons at 1, 2 and 4 wpi. Values represent mean ± SEM (same group of cells as in D; *: p < 0.05, ANOVA).
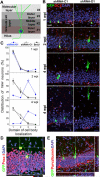
Figure 2.. DISC1 regulates positioning of adult-born neurons but not neuronal subtype differentiation.
(A) A schematic diagram of adult mouse dentate gyrus region divided into four domains. (B, C) Positioning of adult-born neurons. Shown in (B) are sample confocal images of GFP, DAPI and immunostaining for DCX. Scale bar: 20 μm. Shown in (C) are distribution plots of GFP+ neurons expressing shRNA-D1 or shRNA-C1, or BrdU labeled neurons at 1, 2 or 4 wpi. Values represent mean ± SEM (n = 4 animals). (D, E) Neuronal subtype differentiation of adult neural progenitors. Shown are sample confocal images of GFP, DAPI and immunostaining for Prox-1 (D) or Parvalbumin (E) for shRNA-D1/GFP+ neurons at 2 wpi. Scale bar: 50 μm.
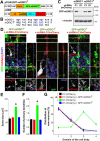
Figure 3.. Rescue of defects from DISC1-knockdown by mDISC1R expression.
(A) Schematic diagrams of lentiviral (pFUW) and retroviral (pUEM) vectors for rescue experiments. (B) Alignment of shRNA-D1 targeting sequence in mDISC1 and silent mutations made in mDISC1R (underlined). (C) Validation of the resistance of mDISC1R to shRNA-D1 in vitro. Expression constructs for GFP-mDISC1 or GFP-mDISC1R and retroviral constructs were co-transfected into 293 cells and cell lysate samples were subjected to Western Blot analysis for GFP and α-tubulin. (D) Sample confocal images of new neurons at 2 wpi. Lentiviruses expressing GFP-mDISC1R and oncoretroviruses co-expressing mCherry and shRNA-D1, or C1 were co-injected in adult mice. Orthogonal views are shown to reveal co-localization of GFP and mCherry and individual channels are shown at the bottom panel. Insets are projection images (mCherry) to show neuronal morphology. Scale bar: 10 μm. (E-G) Summaries of morphological and positioning phenotypes of new neurons at 2 wpi. Shown are summaries for soma size (E), number of primary dendrites (F), and neuronal positioning (G, domains as defined in Figure 2A). Values represent mean ± SEM (n = 4 animals; *: p < 0.05, ANOVA).
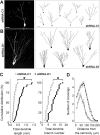
Figure 4.. DISC1 regulates dendritic development of adult-born neurons.
(A, B) Three-dimensional confocal reconstruction of dendrites of GFP+ dentate granule cells at 2 wpi. Shown on the left are sample projections of Z-series confocal images of an shRNA-C1/GFP+ neuron (A) and an shRNA-D1/GFP+ neuron (B). Shown on the right are samples of 2D projection trajectories of 3D confocal reconstruction of cell bodies and dendrites of GFP+ neurons at 2 wpi. Scale bars: 20 μm. (C) Summaries of dendrite properties of new neurons at 2 wpi. Shown are cumulative distribution plots of total dendrite length and branch numbers. Each symbol represents a single GFP+ neuron expressing shRNA-C1 or shRNA-D1 (*: p < 0.01, Kolmogorov-Smirnov test). (D) Sholl analysis of dendritic complexity of GFP+ neurons at 2 wpi. Values represent mean ± SEM (same groups of cells as in C).
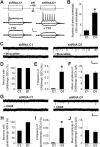
Figure 5.. DISC1 regulates development of intrinsic excitability and formation of functional synapses of adult-born neurons.
(A, B) Firing of repetitive action potentials by GFP+ neurons at 2 wpi. Shown in (A) are sample traces recorded from a GFP+ neuron expressing shRNA-C1 or shRNA-D1 in response to 300 ms current injections (+100, 0, or −50 pA) under the whole-cell current-clamp before and after the addition of TTX (1 μM). Scale bars: 30 mV and 100 ms. Shown in (B) is the summary of the number of action potentials fired in response to current injections (100 pA, 300 ms). Values represent mean ± SEM (n = 9; *: p < 0.05, ANOVA). (C-F) GABAergic synaptic transmission recorded in GFP+ neurons at 2 wpi. Shown in (C) are sample traces of SSCs recorded in a GFP+ neuron expressing shRNA-C1 or shRNA-D1 under the whole-cell voltage-clamp (Vm = −65 mV) in the presence of TTX (1 μM) and kynurenic acid (5 mM). Shown are continuous recordings before and after the addition of bicuculline (10 μM). Scale bars: 20 pA and 100 ms. Also shown are the percentage of GFP+ neurons recorded that exhibited active GABAergic SSCs (D), mean frequency (E) and peak amplitude (F). Values represent mean ± SEM (*: p < 0.01; ANOVA). (G-J) Glutamatergic synaptic transmission recorded in GFP+ neurons at 2 wpi. Similar as in (C-F), except that the recordings were carried out in the presence of TTX (1 μM) and bicuculline (10 μM). Sample traces shown in (G) are continuous recordings before and after the addition of CNQX (50 μM).
Figure 6.. Formation of dendritic spines and synapses in adult-born neurons.
(A) Sample confocal images of shRNA-C1/GFP+ neurons at 2, 4 wpi and an shRNA-D1/GFP+ neuron at 2 wpi. Shown are projections of Z-series confocal images at high magnification to reveal dendritic spine structures. Scale bar: 5 μm. Insets show projection views of GFP+ neurons. Scale bar: 20 μm. (B-G) Electron microscopy analysis of formation of dendritic spines and synapses in normal new granule cells. Shown in (B) is a 3D reconstruction of serial sections through dendrites and soma of an shRNA-C1/GFP+ neuron at 2 wpi (a light micrograph view in the inset, scale bar: 50 μm). Scale bar: 5 μm. The regions within the right and left white boxes in (B) are shown at a higher magnification in (C) and (D), respectively. Scale bar: 2 μm. The boxed region in (D) is shown at a higher magnification in (E) and is an example of a synapse formed onto the dendritic shaft of this neuron. Scale bar: 0.5 μm. “d”: dendrite; “t”: terminal. Shown in (F) is a 3D reconstruction of serial sections through dendrites of an shRNA-C1/GFP+ neuron at 4 wpi (a light micrograph view in the inset). Scale bar: 50 μm. Yellow regions shown in (G) indicate postsynaptic densities identified by EM. Scale bar: 1 μm. (H-M) Presence of dendritic spines and synapses in new neurons with DISC1 knockdown at 2 wpi. Shown in (H) is an electron micrograph of a dendrite of an shRNA-D1/GFP+ neuron at 2wpi (large boxed region in the inset, scale bar: 50 μm). Scale bar: 1 μm. The boxed region in (H) is shown at higher magnification in (I) and (J), which are serial sections through a dendritic spine with an asymmetric synapse containing a dense core vesicle in the axonal terminal (arrows). Scale bars: 0.5 μm. Shown in (K) is a 3D reconstruction of serial sections through a more distal segment of dendrites from the same neuron (the small boxed region within the inset of H). Scale bar: 1 μm. Shown in (L) and (M) are higher magnification images of the synapses found on the dendritic segment within the top and bottom white boxes in (K), respectively. Scale bar: 0.5 μm. “sp”: spine.
Figure 7.. DISC1 cooperates with Ndel1 to regulate development of adult-born neurons.
(A to C) Summaries of morphological and positioning phenotypes of new neurons at 2 wpi with different genetic manipulations. Shown are summaries of soma size (A), number of primary dendrites (B), and neuronal positioning (C, domains as defined in Figure 2A). Values represent mean ± SEM (n = 4 animals; *: p < 0.05, ANOVA). (D, E) Summary of dendritic development of new neurons at 2 wpi. Shown are cumulative distribution plots of total dendritic length and dendritic branch numbers. Each symbol represents a newborn neuron under each condition. Same group of cells as in (A-C). *: p < 0.01 (Kolmogorov-Smirnov test).
Comment in
- DISC1 puts the brakes on neurogenesis.
Dranovsky A, Hen R. Dranovsky A, et al. Cell. 2007 Sep 21;130(6):981-3. doi: 10.1016/j.cell.2007.09.004. Cell. 2007. PMID: 17889641
Similar articles
- DISC1 puts the brakes on neurogenesis.
Dranovsky A, Hen R. Dranovsky A, et al. Cell. 2007 Sep 21;130(6):981-3. doi: 10.1016/j.cell.2007.09.004. Cell. 2007. PMID: 17889641 - Disc1 regulates granule cell migration in the developing hippocampus.
Meyer KD, Morris JA. Meyer KD, et al. Hum Mol Genet. 2009 Sep 1;18(17):3286-97. doi: 10.1093/hmg/ddp266. Epub 2009 Jun 5. Hum Mol Genet. 2009. PMID: 19502360 Free PMC article. - Roles of disrupted-in-schizophrenia 1-interacting protein girdin in postnatal development of the dentate gyrus.
Enomoto A, Asai N, Namba T, Wang Y, Kato T, Tanaka M, Tatsumi H, Taya S, Tsuboi D, Kuroda K, Kaneko N, Sawamoto K, Miyamoto R, Jijiwa M, Murakumo Y, Sokabe M, Seki T, Kaibuchi K, Takahashi M. Enomoto A, et al. Neuron. 2009 Sep 24;63(6):774-87. doi: 10.1016/j.neuron.2009.08.015. Neuron. 2009. PMID: 19778507 - DISC1-binding proteins in neural development, signalling and schizophrenia.
Bradshaw NJ, Porteous DJ. Bradshaw NJ, et al. Neuropharmacology. 2012 Mar;62(3):1230-41. doi: 10.1016/j.neuropharm.2010.12.027. Epub 2010 Dec 31. Neuropharmacology. 2012. PMID: 21195721 Free PMC article. Review. - Adult neurogenesis in the mammalian dentate gyrus.
Abbott LC, Nigussie F. Abbott LC, et al. Anat Histol Embryol. 2020 Jan;49(1):3-16. doi: 10.1111/ahe.12496. Epub 2019 Sep 30. Anat Histol Embryol. 2020. PMID: 31568602 Review.
Cited by
- Epigenetic regulation of neuronal dendrite and dendritic spine development.
Smrt RD, Zhao X. Smrt RD, et al. Front Biol (Beijing). 2010 Aug;5(4):304-323. doi: 10.1007/s11515-010-0650-0. Front Biol (Beijing). 2010. PMID: 25635180 Free PMC article. - NDE1 and NDEL1 from genes to (mal)functions: parallel but distinct roles impacting on neurodevelopmental disorders and psychiatric illness.
Bradshaw NJ, Hayashi MA. Bradshaw NJ, et al. Cell Mol Life Sci. 2017 Apr;74(7):1191-1210. doi: 10.1007/s00018-016-2395-7. Epub 2016 Oct 14. Cell Mol Life Sci. 2017. PMID: 27742926 Free PMC article. Review. - Potential primary roles of glial cells in the mechanisms of psychiatric disorders.
Yamamuro K, Kimoto S, Rosen KM, Kishimoto T, Makinodan M. Yamamuro K, et al. Front Cell Neurosci. 2015 May 15;9:154. doi: 10.3389/fncel.2015.00154. eCollection 2015. Front Cell Neurosci. 2015. PMID: 26029044 Free PMC article. Review. - Changes in dendritic complexity and spine morphology following BCG immunization in APP/PS1 mice.
Li Q, Wang X, Wang ZH, Lin Z, Yang J, Chen J, Wang R, Ye W, Li Y, Wu Y, Xuan A. Li Q, et al. Hum Vaccin Immunother. 2022 Nov 30;18(6):2121568. doi: 10.1080/21645515.2022.2121568. Epub 2022 Sep 16. Hum Vaccin Immunother. 2022. PMID: 36113067 Free PMC article. - Cellular dynamics of neuronal migration in the hippocampus.
Hayashi K, Kubo K, Kitazawa A, Nakajima K. Hayashi K, et al. Front Neurosci. 2015 Apr 24;9:135. doi: 10.3389/fnins.2015.00135. eCollection 2015. Front Neurosci. 2015. PMID: 25964735 Free PMC article. Review.
References
- Altman J, Das GD. Autoradiographic and histological evidence of postnatal hippocampal neurogenesis in rats. J Comp Neurol. 1965:319–335. - PubMed
- Angevine JB., Jr. Time of neuron origin in the hippocampal region. An autoradiographic study in the mouse. Exp Neurol Suppl. 1965;(Suppl 2):1–70. - PubMed
- Arnold SE, Talbot K, Hahn CG. Neurodevelopment, neuroplasticity, and new genes for schizophrenia. Prog Brain Res. 2005;147:319–345. - PubMed
- Austin CP, Ky B, Ma L, Morris JA, Shughrue PJ. Expression of Disrupted-In-Schizophrenia-1, a schizophrenia-associated gene, is prominent in the mouse hippocampus throughout brain development. Neuroscience. 2004;124:3–10. - PubMed
- Ayala R, Shu T, Tsai LH. Trekking across the Brain: The Journey of Neuronal Migration. Cell. 2007;128:29–43. - PubMed
Publication types
MeSH terms
Substances
Grants and funding
- R01 HD069184/HD/NICHD NIH HHS/United States
- R01 AG024984/AG/NIA NIH HHS/United States
- AG024984/AG/NIA NIH HHS/United States
- NS048271/NS/NINDS NIH HHS/United States
- R37 NS047344/NS/NINDS NIH HHS/United States
- R01 HD045757/HD/NICHD NIH HHS/United States
- R56 NS047344/NS/NINDS NIH HHS/United States
- R01 NS048271/NS/NINDS NIH HHS/United States
- R01 NS047344/NS/NINDS NIH HHS/United States
- NS047344/NS/NINDS NIH HHS/United States
- HD045757/HD/NICHD NIH HHS/United States
LinkOut - more resources
Full Text Sources
Other Literature Sources
Medical
Molecular Biology Databases
