High resolution traction force microscopy based on experimental and computational advances - PubMed (original) (raw)
High resolution traction force microscopy based on experimental and computational advances
Benedikt Sabass et al. Biophys J. 2008.
Abstract
Cell adhesion and migration crucially depend on the transmission of actomyosin-generated forces through sites of focal adhesion to the extracellular matrix. Here we report experimental and computational advances in improving the resolution and reliability of traction force microscopy. First, we introduce the use of two differently colored nanobeads as fiducial markers in polyacrylamide gels and explain how the displacement field can be computationally extracted from the fluorescence data. Second, we present different improvements regarding standard methods for force reconstruction from the displacement field, which are the boundary element method, Fourier-transform traction cytometry, and traction reconstruction with point forces. Using extensive data simulation, we show that the spatial resolution of the boundary element method can be improved considerably by splitting the elastic field into near, intermediate, and far field. Fourier-transform traction cytometry requires considerably less computer time, but can achieve a comparable resolution only when combined with Wiener filtering or appropriate regularization schemes. Both methods tend to underestimate forces, especially at small adhesion sites. Traction reconstruction with point forces does not suffer from this limitation, but is only applicable with stationary and well-developed adhesion sites. Third, we combine these advances and for the first time reconstruct fibroblast traction with a spatial resolution of approximately 1 microm.
Figures
FIGURE 1
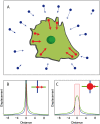
(A) Schematic representation of traction force microscopy on flat elastic substrates. Marker beads in the substrate and the corresponding displacement vector field are shown in blue. Sites of adhesion and the corresponding force vector field are shown in red. (B) If force is assumed to be strongly localized, one can use the concept of point forces, which leads to a divergent displacement field at the site of force application. Here we plot the magnitude of the displacement in two perpendicular directions. When relating force to displacement, the mathematical divergence can be avoided by using a simple cutoff rule. (C) If force is assumed to be spatially extended (here we show constant traction over a circular site of adhesion), then displacement is finite inside the adhesion area. Again we plot the magnitude of the displacement in two perpendicular directions. Traction of 2 kPa (2 nN/_μ_m2) at an adhesion of 2 _μ_m in diameter corresponds to a maximum displacement of 0.3 _μ_m on a 10 kPa substrate. At a distance larger than roughly twice the adhesion size, the displacements resulting from the two assumptions are identical.
FIGURE 2
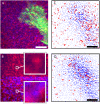
Extracting the displacement field from movement of two types of nanobeads with correlation-based particle tracking velocimetry. (A) The two different nanobeads (each with diameter 40 nm) are shown in red and blue. A fibroblast fluorescently marked with GFP-paxillin is shown in green. (B) Combination of both channels (bottom) shows more, but less distinct features than one channel alone (top). (C) Displacement field extracted from one channel only. Open circles at the base of an arrow indicate that this bead could only be tracked by enlarging the correlation window, effectively lowering the spatial resolution. Solid circles indicate beads which could not be tracked. The resulting mesh size is 700 nm. (D) Displacement field extracted from both channels simultaneously. Despite the displacement density being twice as high as in panel C, the number of enlarged windows and discarded beads is significantly lower. The resulting mesh size is 500 nm. Space bar 5 _μ_m.
FIGURE 3
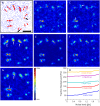
Reconstruction of traction at pointlike adhesions. (A) Random configuration of point forces (red) and resulting displacement field (blue). Space bar 10 mesh sizes (≈5 _μ_m). (B and C) Reconstructed traction magnitude using the boundary element method (BEM). (B) BEM, 0th order regularization. (C) BEM, first-order regularization. (D_–_G) Reconstructed traction magnitude using Fourier-transform traction cytometry (FTTC). (D) FTTC, Gaussian filter. (E) FTTC, Wiener filter. (F) FTTC, 0th order regularization. (G) FTTC, second-order regularization. Solid arrows in panel A mark weak forces which cannot be detected at all. Open arrows mark positions where the reconstruction cannot distinguish between close-by forces in the original pattern. The performance is best for panels B, E, and F, with a spatial resolution of 1 _μ_m. (H) Traction background is a statistical measure (n = 10) for the detection limit and is plotted here as a function of absolute noise (in pixel) for different absolute magnitudes of displacement (median and maximum value given in pixel). Traction background increases stronger with displacement magnitude than with noise.
FIGURE 4
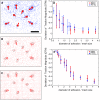
Reconstruction of traction at finite-sized adhesion sites. (A) Circular adhesion sites with constant traction (red) and resulting displacement field (blue). Space bar 10 mesh sizes (≈5 _μ_m). (B) Traction reconstruction with BEM and 0th order regularization for 5% noise. (C) Traction reconstruction with FTTC and Wiener filtering for 5% noise. (D) Deviation of traction magnitude (DTM) as a function of adhesion size (measured in units of mesh size) for 0% noise. DTM is optimal at zero and worst for −1 (complete underestimation) or +1 (complete overestimation). Here DTM is negative, i.e., the traction is systematically underestimated. The inverse scaling (dotted line) of magnitude deviation as a function of adhesion size indicates sampling problems for adhesion sites which are smaller than two mesh-sizes (∼1 _μ_m). (E) Same plot but with 10% noise. Necessary filtering shifts the effective sampling frequency and only adhesion sites larger than four mesh sizes (∼2 _μ_m) can be properly examined (n = 10).
FIGURE 5
Traction reconstruction with point forces (TRPF). (A) Displacement field includes 10% noise. Point forces as calculated with TRPF (green) are localized in the center of adhesion sites (red). Space bar 10 mesh sizes (≈5 _μ_m). (B) Deviation of traction magnitude (DTM) as a function of adhesion size as in Fig. 4, D and E. The underestimation of traction magnitude is small and does not depend strongly on adhesion size with TRPF. (C) Reconstruction of traction when point forces (orange) are not localized exactly in the center of adhesions, as it may occur with small and ill-defined adhesion sites. (D) Standard deviation of traction magnitude and directional error are much higher if point forces are not localized properly (orange) compared to correct localization (green) (n = 10).
FIGURE 6
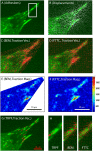
Traction forces at adhesions of a stationary fibroblast. (A) Image section of an extension of a fibroblast marked by GFP-paxillin (green). (B) Overlay with displacement field extracted with two differently colored nanobeads. (C) Traction vector reconstruction using BEM and 0th order regularization. The computational mesh inside the wedge-shaped region is chosen such that the cell contour is well included. (D) Traction vector reconstruction using FTTC with 0th order regularization. The computational mesh is a simple square lattice required for the FFTs. (E) Traction magnitude for the BEM-result. (F) Traction magnitude for the FTTC-result. Units of color bar given in Pascal. Both methods give similar results with a spatial resolution at ∼1 _μ_m and a lower bound for traction detection of ∼500 Pa. (G) Traction vector reconstruction with TRPF. For each adhesion, one point has been selected (for very large adhesions, two points have been selected). (H) Comparison of TRPF, BEM, and FTTC for the region of interest marked in panel A around one large adhesion.
Similar articles
- Optimization of traction force microscopy for micron-sized focal adhesions.
Stricker J, Sabass B, Schwarz US, Gardel ML. Stricker J, et al. J Phys Condens Matter. 2010 May 19;22(19):194104. doi: 10.1088/0953-8984/22/19/194104. J Phys Condens Matter. 2010. PMID: 20523913 Free PMC article. - Compressed sensing traction force microscopy.
Brask JB, Singla-Buxarrais G, Uroz M, Vincent R, Trepat X. Brask JB, et al. Acta Biomater. 2015 Oct;26:286-94. doi: 10.1016/j.actbio.2015.08.023. Epub 2015 Aug 21. Acta Biomater. 2015. PMID: 26300336 - Quantifying force transmission through fibroblasts: changes of traction forces under external shearing.
Huth S, Blumberg JW, Probst D, Lammerding J, Schwarz US, Selhuber-Unkel C. Huth S, et al. Eur Biophys J. 2022 Mar;51(2):157-169. doi: 10.1007/s00249-021-01576-8. Epub 2021 Oct 28. Eur Biophys J. 2022. PMID: 34713316 Free PMC article. - Traction force microscopy on soft elastic substrates: A guide to recent computational advances.
Schwarz US, Soiné JR. Schwarz US, et al. Biochim Biophys Acta. 2015 Nov;1853(11 Pt B):3095-104. doi: 10.1016/j.bbamcr.2015.05.028. Epub 2015 May 27. Biochim Biophys Acta. 2015. PMID: 26026889 Review. - 2.5D Traction Force Microscopy: Imaging three-dimensional cell forces at interfaces and biological applications.
Delanoë-Ayari H, Hiraiwa T, Marcq P, Rieu JP, Saw TB. Delanoë-Ayari H, et al. Int J Biochem Cell Biol. 2023 Aug;161:106432. doi: 10.1016/j.biocel.2023.106432. Epub 2023 Jun 7. Int J Biochem Cell Biol. 2023. PMID: 37290687 Review.
Cited by
- Interplay among cell migration, shaping, and traction force on a matrix with cell-scale stiffness heterogeneity.
Ebata H, Kidoaki S. Ebata H, et al. Biophys Physicobiol. 2022 Sep 13;19:e190036. doi: 10.2142/biophysico.bppb-v19.0036. eCollection 2022. Biophys Physicobiol. 2022. PMID: 36349327 Free PMC article. - Multimodal analysis of traction forces and the temperature dynamics of living cells with a diamond-embedded substrate.
Kołodziej T, Mrózek M, Sengottuvel S, Głowacki MJ, Ficek M, Gawlik W, Rajfur Z, Wojciechowski AM. Kołodziej T, et al. Biomed Opt Express. 2024 Jun 3;15(7):4024-4043. doi: 10.1364/BOE.524293. eCollection 2024 Jul 1. Biomed Opt Express. 2024. PMID: 39022544 Free PMC article. - Optimization of traction force microscopy for micron-sized focal adhesions.
Stricker J, Sabass B, Schwarz US, Gardel ML. Stricker J, et al. J Phys Condens Matter. 2010 May 19;22(19):194104. doi: 10.1088/0953-8984/22/19/194104. J Phys Condens Matter. 2010. PMID: 20523913 Free PMC article. - The Interplay Between Cell-Cell and Cell-Matrix Forces Regulates Cell Migration Dynamics.
Bajpai A, Tong J, Qian W, Peng Y, Chen W. Bajpai A, et al. Biophys J. 2019 Nov 19;117(10):1795-1804. doi: 10.1016/j.bpj.2019.10.015. Epub 2019 Oct 23. Biophys J. 2019. PMID: 31706566 Free PMC article. - Probing cellular traction forces by micropillar arrays: contribution of substrate warping to pillar deflection.
Schoen I, Hu W, Klotzsch E, Vogel V. Schoen I, et al. Nano Lett. 2010 May 12;10(5):1823-30. doi: 10.1021/nl100533c. Nano Lett. 2010. PMID: 20387859 Free PMC article.
References
- Geiger, B., and A. Bershadsky. 2002. Exploring the neighborhood: adhesion-coupled cell mechanosensors. Cell. 110:139–142. - PubMed
- Discher, D. E., P. Janmey, and Y.-L. Wang. 2005. Tissue cells feel and respond to the stiffness of their substrate. Science. 310:1139–1143. - PubMed
- Orr, A. W., B. P. Helmke, B. R. Blackman, and M. A. Schwartz. 2006. Mechanisms of mechanotransduction. Dev. Cell. 10:11–20. - PubMed
- Vogel, V., and M. Sheetz. 2006. Local force and geometry sensing regulate cell functions. Nat. Rev. Mol. Cell Biol. 7:265–275. - PubMed
- Schwarz, U. S. 2007. Soft matters in cell adhesion: rigidity sensing on soft elastic substrates. Soft Matter. 3:263–266. - PubMed
Publication types
MeSH terms
LinkOut - more resources
Full Text Sources
Other Literature Sources
