Vesicle pool heterogeneity at hippocampal glutamate and GABA synapses - PubMed (original) (raw)
Comparative Study
Vesicle pool heterogeneity at hippocampal glutamate and GABA synapses
Krista L Moulder et al. J Neurosci. 2007.
Abstract
Glutamate and GABA are the major fast excitatory and inhibitory neurotransmitters, respectively, in the CNS. Although glutamate and GABA have clearly distinct postsynaptic actions, we are just beginning to appreciate that presynaptic differences between glutamatergic and GABAergic neurons may contribute to distinct functions of these transmitter systems. We therefore probed possible differences between the functional synaptic vesicle populations of glutamatergic and GABAergic neurons. We examined superecliptic synaptopHluorin (SpH) fluorescence during 20 Hz electrical stimulation in transfected hippocampal neurons and identified the phenotype of SpH-fluorescent synapses with post hoc immunostaining. With 200 stimuli (10 s), individual glutamate synapses displayed considerably more variability in peak SpH fluorescence than GABA synapses, without a strong difference in the mean SpH fluorescence increase. This spatial heterogeneity could not be accounted for by differences in endocytosis, which was nearly constant over these short time periods across glutamate and GABA synapses. Instead, variability in vesicle exocytosis correlated with variability in total vesicle staining and in measures of the total recycling pool size. Differences were also evident using FM1-43 [N-(3-triethylammoniumpropyl)-4-(4-(dibutylamino)styryl) pyridinium dibromide] uptake. These data support the idea that the population of glutamate synapses exhibits more heterogeneity in release properties than the population of GABA synapses, possibly correlated with glutamatergic synaptic malleability.
Figures
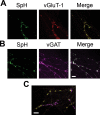
Figure 1.
Post hoc immunolabeling identifies phenotype in SpH-positive neurons. A, B, Representative difference images of SpH fluorescence after 5 s stimulation at 20 Hz (green, left), paired with corresponding vGluT-1 (red, A) or vGAT (magenta, B) immunostains (middle). These images illustrate glutamatergic (A) and GABAergic (B) neurons expressing SpH. Scale bar, 10 μm. C, Representative image of synapses from a glutamatergic (vGluT-1 stain, red), SpH-positive neuron (green; shown combined as yellow), with surrounding vGAT puncta (magenta) from nontransfected neurons. Scale bar, 5 μm.
Figure 2.
Glutamate synapses exhibit more heterogeneity in SpH fluorescence increases than do GABA synapses. A, B, Five representative examples of SpH fluorescence increases at puncta induced by 20 Hz stimulation of a field containing a transfected glutamatergic neuron (A) and a field containing a transfected GABAergic neuron (B). SpH fluorescence was monitored with laser scans taken every 1 s. C, Histograms of peak SpH fluorescence (Δ_F_/_F_0) from glutamatergic (black) and GABAergic (gray) puncta. Bin size was 0.1 arbitrary units. n = 27 (glutamate) and 23 (GABA).
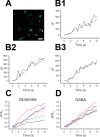
Figure 3.
Endocytosis does not account for higher variance of SpH fluorescence at glutamatergic terminals. A, Representative difference image of SpH fluorescence after 10 s stimulation at 20 Hz in the presence of 67 n
m
folimycin. Numbers indicate puncta detailed in B1–B3. Scale bar, 5 μm. B, SpH fluorescence of the indicated puncta from A during stimulation in the presence (solid lines) and absence (dashed lines) of folimycin. C, D, Five representative examples of SpH fluorescence increases induced by 20 Hz stimulation in the presence of folimycin in a glutamatergic (C) and a GABAergic (D) neuron. SpH fluorescence was monitored with scans performed every 386 ms.
Figure 4.
Dynamic changes in exocytosis do not account for spatial heterogeneity. A, Average normalized exocytosis, as determined using SpH fluorescence increases in the presence of folimycin during 20 Hz stimulation in glutamate (filled symbols; n = 75) and GABA (open symbols; n = 69) synapses. Fluorescence increases were normalized to the final value at 10 s to highlight any changes in the slope approaching the final fluorescence value. Both glutamate and GABA SpH fluorescence increases were relatively linear over this time frame. The slope of the normalized mean fluorescence change in glutamate synapses (solid line) was 0.11 ± 0.01 Δ_F_/F_0 per second; the slope in GABA synapses (dashed line) was 0.10 ± 0.01 Δ_F/_F_0 per second. B, Average exocytosis of the top (filled symbols; n = 19) and bottom (open symbols; n = 19) quartiles of glutamate synapses. Again, both subsets were well described as a linear increase in fluorescence over this range, suggesting no differences in the dynamics of presynaptic function at low-fluorescence glutamate synapses versus high-fluorescence glutamate synapses. The slope of the mean fluorescence change was 0.11 for both the top (solid line) and bottom (dashed line) quartiles. C, D, Two hundred stimuli were delivered at 20 Hz (filled bars) and at 1 Hz (open bars) in the presence of 67 n
m
folimycin, and SpH fluorescence increases were measured at the same synapses. C, Peak fluorescence values at glutamate and GABA synapses after 200 stimuli. D, Coefficient of variation for exocytosis values at glutamate and GABA synapses after stimulation at 20 or 1 Hz. For C and D, n = 32 (glutamate) and 34 (GABA).
Figure 5.
Recycling pool size correlates with differences in exocytosis. A, Average SpH fluorescence increases in the presence of folimycin during 20 Hz stimulation (n = 20; 10 glutamate and 10 GABA terminals). Time to reach saturation was similar for glutamate and GABA synapses. Images were acquired every 10 s. B, C, Peak exocytosis (Δ_F_/F_0) with 10 s of 20 Hz stimulation correlates with the maximal amount of exocytosis (Δ_F/_F_0), measured after 2 min of stimulation, in both glutamate (B) and GABA (C) synapses. For B, n = 40; _r_2 = 0.734. For C, n = 32; _r_2 = 0.754.
Figure 6.
Recycling pool size as measured with FM1-43FX labeling is more variable in glutamatergic neurons. A–D, Evoked postsynaptic currents were recorded in solitary microisland cultures from glutamatergic (A) and GABAergic (B) neurons. The presynaptic stimulus has been blanked. The slower kinetics of response in B are diagnostic of GABAA receptor kinetics; high Cl− concentration in the patch pipette was used to amplify GABA current amplitude at −70 mV and yielded inward currents for both glutamate and GABA responses (Mennerick et al., 1995). Synapses from these neurons were then labeled with FM1-43FX (C, D). The field in C was obtained from the neuron whose excitatory postsynaptic current is shown in A; the field in D was obtained from the neuron whose postsynaptic current is shown in B. Scale bar, 4 μm. E, Box plots of FM1-43FX integrated intensities from synapses in electrophysiologically identified glutamatergic or GABAergic neurons. Dotted lines indicate mean values, solid lines indicate median values, box edges represent 25–75% values, and whiskers represent 10–90% values. n = 120 synapses each. AU, Arbitrary units.
Figure 7.
Exocytosis correlates with total vesicle pool size. A, B, Peak SpH fluorescence with 10 s of 20 Hz stimulation in the presence of folimycin correlates with vGluT-1 (A) or vGAT (B). For A, _r_2 = 0.889. For B, _r_2 = 0.912. C, Histograms of the integrated intensities of vGluT-1 (black) and vGAT (gray) puncta. Integrated intensity was calculated as the area of a punctum (defined by a freeform region of interest molded to the punctum) multiplied by the intensity of pixels exceeding threshold in this region. Bin size was 25,000 arbitrary units. For A–C, n = 75 (glutamate) and 69 (GABA).
Figure 8.
Variability differences are synaptic and persist at various developmental stages. A, Representative image of vGluT-1 (green) and GluR2 (red) colocalization. Scale bar, 5 μm. B, Histograms of the integrated intensities for all vGluT-1 puncta (black) and for only the subset of vGluT-1 puncta apposed to GluR2 puncta (“synaptic”; gray). Bin size was 25,000 arbitrary units. n = 140 (all) and 103 (synaptic). C, vGluT-1 or vGAT integrated intensity values at synapses from neurons at DIV 6–8 (Young) or DIV 18–20 (Old). Dotted lines indicate mean values, solid lines indicate median values, box edges represent 25–75% values, and error bars represent 10–90% values. n = 100 (glutamate, 6–8 d), 108 (GABA, 6–8 d), 108 (glutamate 18–20 d), and 98 (GABA, 18–20 d).
Figure 9.
Glutamate synapse size does not correlate with distance from similarly sized puncta. A, Linear distance to all vGluT-1-positive puncta in a 50 × 50 μm field was measured from the smallest vGluT-1-positive punctum and the integrated intensity of those puncta plotted as a function of that distance. n = 68; _r_2 = 0.003. B, C, Montaged images of individual neurites immunostained for vGluT-1 were used to examine the relationship between integrated intensities of vGluT-1 puncta and their distance along a contiguous length of axon. A representative neurite segment (<30 μm) contacted by a presumed single axon is shown in B. In C, integrated intensities of vGluT-1 puncta are plotted as a function of their distance along the axon. The gray symbols represent the puncta numbered in B. Note that, even in this relatively short (<30 μm) segment, puncta size spans almost the entire range of measured integrated intensities. n = 92; _r_2 = 0.009.
Similar articles
- Potassium ion- and nitric oxide-induced exocytosis from populations of hippocampal synapses during synaptic maturation in vitro.
Sporns O, Jenkinson S. Sporns O, et al. Neuroscience. 1997 Oct;80(4):1057-73. doi: 10.1016/s0306-4522(97)00152-8. Neuroscience. 1997. PMID: 9284060 - Unique pH dynamics in GABAergic synaptic vesicles illuminates the mechanism and kinetics of GABA loading.
Egashira Y, Takase M, Watanabe S, Ishida J, Fukamizu A, Kaneko R, Yanagawa Y, Takamori S. Egashira Y, et al. Proc Natl Acad Sci U S A. 2016 Sep 20;113(38):10702-7. doi: 10.1073/pnas.1604527113. Epub 2016 Sep 6. Proc Natl Acad Sci U S A. 2016. PMID: 27601664 Free PMC article. - Effects of reduced vesicular filling on synaptic transmission in rat hippocampal neurones.
Zhou Q, Petersen CC, Nicoll RA. Zhou Q, et al. J Physiol. 2000 May 15;525 Pt 1(Pt 1):195-206. doi: 10.1111/j.1469-7793.2000.t01-1-00195.x. J Physiol. 2000. PMID: 10811737 Free PMC article. - GABA vesicles at synapses: are there 2 distinct pools?
Hablitz JJ, Mathew SS, Pozzo-Miller L. Hablitz JJ, et al. Neuroscientist. 2009 Jun;15(3):218-24. doi: 10.1177/1073858408326431. Neuroscientist. 2009. PMID: 19436074 Free PMC article. Review. - The dual glutamatergic-GABAergic phenotype of hippocampal granule cells.
Gutiérrez R. Gutiérrez R. Trends Neurosci. 2005 Jun;28(6):297-303. doi: 10.1016/j.tins.2005.04.005. Trends Neurosci. 2005. PMID: 15927685 Review.
Cited by
- Dynamic modulation of phasic and asynchronous glutamate release in hippocampal synapses.
Chang CY, Mennerick S. Chang CY, et al. J Neurophysiol. 2010 Jan;103(1):392-401. doi: 10.1152/jn.00683.2009. Epub 2009 Nov 4. J Neurophysiol. 2010. PMID: 19889850 Free PMC article. - From Synaptic Physiology to Synaptic Pathology: The Enigma of α-Synuclein.
Nordengen K, Morland C. Nordengen K, et al. Int J Mol Sci. 2024 Jan 12;25(2):986. doi: 10.3390/ijms25020986. Int J Mol Sci. 2024. PMID: 38256059 Free PMC article. Review. - Acute dynamin inhibition dissects synaptic vesicle recycling pathways that drive spontaneous and evoked neurotransmission.
Chung C, Barylko B, Leitz J, Liu X, Kavalali ET. Chung C, et al. J Neurosci. 2010 Jan 27;30(4):1363-76. doi: 10.1523/JNEUROSCI.3427-09.2010. J Neurosci. 2010. PMID: 20107062 Free PMC article. - Autaptic Cultures: Methods and Applications.
Bekkers JM. Bekkers JM. Front Synaptic Neurosci. 2020 Apr 30;12:18. doi: 10.3389/fnsyn.2020.00018. eCollection 2020. Front Synaptic Neurosci. 2020. PMID: 32425765 Free PMC article. - Acute knockdown of AMPA receptors reveals a trans-synaptic signal for presynaptic maturation.
Tracy TE, Yan JJ, Chen L. Tracy TE, et al. EMBO J. 2011 Apr 20;30(8):1577-92. doi: 10.1038/emboj.2011.59. Epub 2011 Mar 4. EMBO J. 2011. PMID: 21378752 Free PMC article.
References
- Ahmari SE, Buchanan J, Smith SJ. Assembly of presynaptic active zones from cytoplasmic transport packets. Nat Neurosci. 2000;3:445–451. - PubMed
- Cao YQ, Piedras-Renteria ES, Smith GB, Chen G, Harata NC, Tsien RW. Presynaptic Ca2+ channels compete for channel type-preferring slots in altered neurotransmission arising from Ca2+ channelopathy. Neuron. 2004;43:387–400. - PubMed
Publication types
MeSH terms
Substances
Grants and funding
- K01 DA018109/DA/NIDA NIH HHS/United States
- DA018109/DA/NIDA NIH HHS/United States
- MH78823/MH/NIMH NIH HHS/United States
- NS54174/NS/NINDS NIH HHS/United States
- NS048826/NS/NINDS NIH HHS/United States
- R01 NS054174/NS/NINDS NIH HHS/United States
- R01 NS048826/NS/NINDS NIH HHS/United States
- P30 NS057105/NS/NINDS NIH HHS/United States
- R01 MH078823/MH/NIMH NIH HHS/United States
LinkOut - more resources
Full Text Sources


