Transforming growth factor-beta can suppress tumorigenesis through effects on the putative cancer stem or early progenitor cell and committed progeny in a breast cancer xenograft model - PubMed (original) (raw)
. 2007 Sep 15;67(18):8643-52.
doi: 10.1158/0008-5472.CAN-07-0982.
Naomi Yoo, Mary Vu, Mizuko Mamura, Jeong-Seok Nam, Akira Ooshima, Zhijun Du, Pierre-Yves Desprez, Miriam R Anver, Aleksandra M Michalowska, Joanna Shih, W Tony Parks, Lalage M Wakefield
Affiliations
- PMID: 17875704
- PMCID: PMC2427144
- DOI: 10.1158/0008-5472.CAN-07-0982
Transforming growth factor-beta can suppress tumorigenesis through effects on the putative cancer stem or early progenitor cell and committed progeny in a breast cancer xenograft model
Binwu Tang et al. Cancer Res. 2007.
Abstract
The transforming growth factor-beta (TGF-beta) pathway has tumor-suppressor activity in many epithelial tissues. Because TGF-beta is a potent inhibitor of epithelial cell proliferation, it has been widely assumed that this property underlies the tumor-suppressor effect. Here, we have used a xenograft model of breast cancer to show that endogenous TGF-beta has the potential to suppress tumorigenesis through a novel mechanism, involving effects at two distinct levels in the hierarchy of cellular progeny that make up the epithelial component of the tumor. First, TGF-beta reduces the size of the putative cancer stem or early progenitor cell population, and second it promotes differentiation of a more committed, but highly proliferative, progenitor cell population to an intrinsically less proliferative state. We further show that reduced expression of the type II TGF-beta receptor correlates with loss of luminal differentiation in a clinical breast cancer cohort, suggesting that this mechanism may be clinically relevant. At a molecular level, the induction of differentiation by TGF-beta involves down-regulation of Id1, and forced overexpression of Id1 can promote tumorigenesis despite persistence of the antiproliferative effect of TGF-beta. These data suggest new roles for the TGF-beta pathway in regulating tumor cell dynamics that are independent of direct effects on proliferation.
Figures
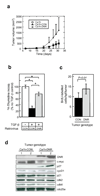
Fig. 1. Effects of loss of TGF-β response on tumorigenesis and proliferation in Ca1h cells
(a) Tumor growth kinetics for Ca1h parental or retrovirally transduced cells growing as subcutaneous xenografts in nude mice. 7.5 × 10⁵ cells were injected/site. Results are the mean +/− S.D. for 4 (Ca1h) or 10 (Ca1h-CON and Ca1h-DNR) tumors/group. (b) Effect of 200pM TGF-β on proliferation of Ca1h cells in vitro determined by 3H-Thymidine incorporation. Results are mean +/− S.D. for 3 determinations. * indicates p<0.05. (c) Effect of loss of TGF-β response on proliferation of Ca1h tumors in vivo, determined by quantitation of BrdU-labelled tumor cells (6 tumors/genotype group; ≥25 high power fields quantitated/tumor). (d) Western blot analysis of expression of cell cycle regulators in protein extracts from Ca1h tumors. Data are shown for two representative tumors of each genotype group.
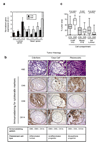
Fig. 2. Loss of TGF-β response is associated with loss of differentiation in the Ca1h model
(a) RTQ-PCR analysis of relative expression of basal and luminal marker genes in Ca1h-CON and Ca1h-DNR tumors. Results are the mean +/−SEM for 3 tumors of each genotype and are normalized to expression of the 18S rRNA transcript. CON, tumors from Ca1h cells transduced with empty retrovirus; DNR, tumors from Ca1h cells transduced with the dominant negative TβRII. (b) Representative H&E stained sections of a Ca1h tumor, showing the three predominant histologies that make up the tumor, and immunohistochemical analysis of cyokeratin expression within a given histologic region. In each case, the histology of interest lies within the dotted lines. The table below summarizes cytokeratin marker staining patterns and the deduced identity of the dominant cell type for each histology. (c) Quantitation of the % tumor area occupied by each of the three major cell compartments, identified as above. Prog, progenitor; Diff, differentiated; Undiff, undifferentiated; CON, tumors from Ca1h cells transduced with empty retrovirus; DNR, tumors from Ca1h cells transduced with the dominant negative TβRII. The boxes indicated the median and quartile values, while the whiskers show the 95% confidence interval. Data represent the combined results of 3 independent experiments, for a total of 32 (CON) and 30 (DNR) tumors analyzed.
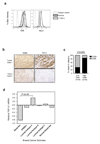
Fig. 3. TGF-β promotes differentiation of Ca1h cells in vitro, and TGF-β pathway status correlates with differentiation in clinical breast cancer samples
(a) TGF-β effects on expression of luminal markers by Ca1h cells in vitro. Expression of the differentiated luminal markers cytokeratin 8 (CK8) or MUC1 was determined by FACS analysis following treatment with 5ng/ml TGF-β (bold line, no shading) or vehicle control (bold line, gray shading) for 3 days. The thin line indicates staining with the isotype control antibody. (b) Correlation between TβRII and differentiation in clinical breast cancer samples. Adjacent sections of the Imgenex human breast cancer array were immunostained for TβRII or cytokeratin 8 (CK8). Brown indicates positive staining. Two representative tumors are shown. (c) Individual tumors were scored as high or low for TβRII expression, and positive or negative for CK8. The % of cases in each of the two TβRII categories that were CK8 positive (black bars) or CK8 negative (grey bars) is indicated. n gives the number of tumors analyzed. (d) Relative expression of TGF-β1 mRNA in different subclasses of breast cancer. The publicly available cDNA gene expression data (18) were downloaded from the Stanford Microarray Database and normalized. Classification of breast carcinomas was adopted from Sorlie et al. (18). The values represent mean differences among the cancer subtypes relative to median level of TGFB1 expression across all samples. Differential expression in TGFB1 was tested using one-way ANOVA (overall F-test p = 4.73E-07) and specific comparison between the Luminal Subtype A and Basal-like groups (p= 2.24E-09).
Fig. 4. TGF-β treatment reduces the size of the SP fraction and the ability to form tumorspheres
(a) FACS analysis of Hoechst dye staining patterns for Ca1h cells in vitro. The SP fraction, which actively pumps out the Hoechst dye, is identified as the poorly staining cell population (indicated by red triangle) that largely disappears when the ATP binding cassette (ABC) transporters are inhibited with verapamil. (b) Effect of TGF-β treatment on the SP fraction for 3 different mammary/breast cancer cell lines. The size of the SP population was determined by FACS analysis following treatment with TGF-β (5ng/ml) for 24 hours. Results for Ca1h cells are the mean +/− S.E.M. for 3 independent experiments. (c) Blocking TGF-β response with the DNR increases the equilibrium SP fraction in Ca1h tumors. Ca1h tumors were digested and FACS analysis was performed on the resulting single cell suspension. Results represent the mean +/− SEM for 3 individual tumors/genotype. CON, control; DNR, dominant negative TβRII. (d) Effect of TGF-β on tumorsphere formation by Ca1h cells. The ability of Ca1h cells cultured in low attachment dishes to form tumorspheres was determined as described in Methods. Where indicated, cells were pre-treated with 5ng/ml TGF-β for 24 hours prior to trypsinization and replating in low attachment dishes in the absence of TGF-β. Results represent the means +/− SEM of three replicate wells for each condition. Inset: phase contrast image of tumorsphere formed by Ca1h cells.
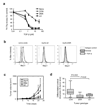
Fig. 5. Id1 blocks promotion of differentiation and partially blocks suppression of tumorigenesis by TGF-β, while not affecting growth inhibition
(a) Antiproliferative effect of TGF-β on genetically modified Ca1h cells, as assessed by 3H-Thymidine incorporation. All data are normalized to the no TGF-β condition for the particular cell line. Results are the means +/− SD for 3 replicate wells. (b) Ability of TGF-β to promote luminal differentiation in genetically modified Ca1h cells. Expression of the differentiated luminal marker Muc1 in genetically modified Ca1h cells was determined by FACS analysis following treatment with 5ng/ml TGF-β (bold line, no shading) or vehicle control (bold line, gray shading) for 3 days. The thin line indicates staining with the isotype control antibody. (c) Effect of Id1 overexpression on growth of Ca1h tumors in vivo. Results are the mean +/− S.D. for 4 (Ca1h) or 12 (Ca1h-CON, Ca1h-DNR and Ca1h-Id1) tumors/group. (d) Effect of Id1 overexpression on Ca1h tumor differentiation. The % of tumor area occupied by differentiated luminal structures as determined histologically is shown for the three tumor genotypes. The boxes indicate the median and quartile values, while the whiskers show the 95% confidence interval. 12 tumors were analyzed/genotype group.
Similar articles
- TGF-beta receptor type-2 expression in cancer-associated fibroblasts regulates breast cancer cell growth and survival and is a prognostic marker in pre-menopausal breast cancer.
Busch S, Acar A, Magnusson Y, Gregersson P, Rydén L, Landberg G. Busch S, et al. Oncogene. 2015 Jan 2;34(1):27-38. doi: 10.1038/onc.2013.527. Epub 2013 Dec 16. Oncogene. 2015. PMID: 24336330 Clinical Trial. - HER-2 overexpression differentially alters transforming growth factor-beta responses in luminal versus mesenchymal human breast cancer cells.
Wilson CA, Cajulis EE, Green JL, Olsen TM, Chung YA, Damore MA, Dering J, Calzone FJ, Slamon DJ. Wilson CA, et al. Breast Cancer Res. 2005;7(6):R1058-79. doi: 10.1186/bcr1343. Epub 2005 Nov 8. Breast Cancer Res. 2005. PMID: 16457687 Free PMC article. - Transforming Growth Factor-β Promotes Liver Tumorigenesis in Mice via Up-regulation of Snail.
Moon H, Ju HL, Chung SI, Cho KJ, Eun JW, Nam SW, Han KH, Calvisi DF, Ro SW. Moon H, et al. Gastroenterology. 2017 Nov;153(5):1378-1391.e6. doi: 10.1053/j.gastro.2017.07.014. Epub 2017 Jul 20. Gastroenterology. 2017. PMID: 28734833 - Transforming growth factor-beta and breast cancer: Tumor promoting effects of transforming growth factor-beta.
Dumont N, Arteaga CL. Dumont N, et al. Breast Cancer Res. 2000;2(2):125-32. doi: 10.1186/bcr44. Epub 2000 Feb 21. Breast Cancer Res. 2000. PMID: 11250702 Free PMC article. Review. - Malignant cells, directors of the malignant process: role of transforming growth factor-beta.
Teicher BA. Teicher BA. Cancer Metastasis Rev. 2001;20(1-2):133-43. doi: 10.1023/a:1013177011767. Cancer Metastasis Rev. 2001. PMID: 11831642 Review.
Cited by
- Transforming growth factor β as regulator of cancer stemness and metastasis.
Bellomo C, Caja L, Moustakas A. Bellomo C, et al. Br J Cancer. 2016 Sep 27;115(7):761-9. doi: 10.1038/bjc.2016.255. Epub 2016 Aug 18. Br J Cancer. 2016. PMID: 27537386 Free PMC article. Review. - The Outcome of TGFβ Antagonism in Metastatic Breast Cancer Models In Vivo Reflects a Complex Balance between Tumor-Suppressive and Proprogression Activities of TGFβ.
Yang Y, Yang HH, Tang B, Wu AML, Flanders KC, Moshkovich N, Weinberg DS, Welsh MA, Weng J, Ochoa HJ, Hu TY, Herrmann MA, Chen J, Edmondson EF, Simpson RM, Liu F, Liu H, Lee MP, Wakefield LM. Yang Y, et al. Clin Cancer Res. 2020 Feb 1;26(3):643-656. doi: 10.1158/1078-0432.CCR-19-2370. Epub 2019 Oct 3. Clin Cancer Res. 2020. PMID: 31582516 Free PMC article. - Loss of TGF-β signaling and PTEN promotes head and neck squamous cell carcinoma through cellular senescence evasion and cancer-related inflammation.
Bian Y, Hall B, Sun ZJ, Molinolo A, Chen W, Gutkind JS, Waes CV, Kulkarni AB. Bian Y, et al. Oncogene. 2012 Jul 12;31(28):3322-32. doi: 10.1038/onc.2011.494. Epub 2011 Oct 31. Oncogene. 2012. PMID: 22037217 Free PMC article. - Aberrant TGFβ/SMAD4 signaling contributes to epigenetic silencing of a putative tumor suppressor, RunX1T1 in ovarian cancer.
Yeh KT, Chen TH, Yang HW, Chou JL, Chen LY, Yeh CM, Chen YH, Lin RI, Su HY, Chen GC, Deatherage DE, Huang YW, Yan PS, Lin HJ, Nephew KP, Huang TH, Lai HC, Chan MW. Yeh KT, et al. Epigenetics. 2011 Jun;6(6):727-39. doi: 10.4161/epi.6.6.15856. Epub 2011 Jun 1. Epigenetics. 2011. PMID: 21540640 Free PMC article. - The TGF-beta paradox in human cancer: an update.
Tian M, Schiemann WP. Tian M, et al. Future Oncol. 2009 Mar;5(2):259-71. doi: 10.2217/14796694.5.2.259. Future Oncol. 2009. PMID: 19284383 Free PMC article. Review.
References
- Derynck R, Akhurst RJ, Balmain A. TGF-β signaling in tumor suppression and cancer progression. Nat Genet. 2001;29:117–129. - PubMed
- Engle SJ, Hoying JB, Boivin GP, Ormsby I, Gartside PS, Doetschman T. Transforming growth factor β1 suppresses nonmetastatic colon cancer at an early stage of tumorigenesis. Cancer Res. 1999;59:3379–3386. - PubMed
- Tobin SW, Douville K, Benbow U, Brinckerhoff CE, Memoli VA, Arrick BA. Consequences of altered TGF-β expression and responsiveness in breast cancer: evidence for autocrine and paracrine effects. Oncogene. 2002;21:108–118. - PubMed
Publication types
MeSH terms
Substances
LinkOut - more resources
Full Text Sources
Other Literature Sources
Medical
Molecular Biology Databases


