Postsynaptic positioning of endocytic zones and AMPA receptor cycling by physical coupling of dynamin-3 to Homer - PubMed (original) (raw)
Postsynaptic positioning of endocytic zones and AMPA receptor cycling by physical coupling of dynamin-3 to Homer
Jiuyi Lu et al. Neuron. 2007.
Abstract
Endocytosis of AMPA receptors and other postsynaptic cargo occurs at endocytic zones (EZs), stably positioned sites of clathrin adjacent to the postsynaptic density (PSD). The tight localization of postsynaptic endocytosis is thought to control spine composition and regulate synaptic transmission. However, the mechanisms that situate the EZ near the PSD and the role of spine endocytosis in synaptic transmission are unknown. Here, we report that a physical link between dynamin-3 and the postsynaptic adaptor Homer positions the EZ near the PSD. Disruption of dynamin-3 or its interaction with Homer uncouples the PSD from the EZ, resulting in synapses lacking postsynaptic clathrin. Loss of the EZ leads to a loss of synaptic AMPA receptors and reduced excitatory synaptic transmission that corresponds with impaired synaptic recycling. Thus, a physical link between the PSD and the EZ ensures localized endocytosis and recycling by recapturing and maintaining a proximate pool of cycling AMPA receptors.
Figures
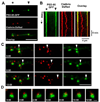
Figure 1. The Endocytic Zone is Stably Positioned Near the PSD
(A) Dendritic branch of a hippocampal neuron (17 DIV) co-expressing PSD-95-GFP and clathrin-DsRed. Scale bar, 4 µm. The asterisk and arrowhead mark points along the dendrite used for the kymograph analysis in (B). (B) Kymograph analysis of fluorescence intensity along the dendritic branch (horizontal) over time (vertical) during a time lapse with images acquired every 14 sec. The asterisk and arrowhead mark points along the dendrite corresponding to positions in (A). See Supplementary Movie S1. (C) The occasional mobile cluster of PSD-95 (arrowhead, green) continues to have an associated clathrin punctum (red). The structure moved at an average rate of 0.20 µm/min. Time in min:sec is indicated. Scale bar, 5 µm. See Supplementary Movie S2. (D) Clathrin (red) remains near the PSD (green) even as it undergoes changes in size and morphology. Time in min:sec is indicated. Scale bar, 1 µm. See Supplementary Movie S3.
Figure 2. Dynamin-3 Concentrates in Dendritic Spines and Correlates with the Presence of an Endocytic Zone
(A) Confocal image of endogenous dynamin-3 (eDyn3) staining in a hippocampal neuron (DIV 34) expressing GFP. White dashed circles indicate regions selected for spine and shaft intensity measurement. Scale bar, 2 µm. (B) Quantification of spine enrichment. Data represent means ± SEM of spine/shaft fluorescence intensity ratios. n = 8 neurons, 270 spines respectively, ** p < 0.001 relative to GFP, t-test. (C) Confocal images of endogenous dynamin-3 (eDyn3) staining in hippocampal neurons expressing GFP and clathrin-DsRed. Spines lacking dynamin-3 also lacked clathrin (yellow dashed circle, arrowhead). Scale bar, 2 µm. (D) Quantification of dynamin-3 (Dyn3) in spines that contain (EZ+) or lack (EZ−) an endocytic zone. Integrated Dyn3 intensity in the dashed circles was measured. Left, means ± SEM of dynamin-3 fluorescence intensity. EZ+, 557 spines, EZ−, 98 spines; n = 9 neurons; ** p < 0.001 relative to EZ+ spines, t-test. Right, histogram analysis of dynamin-3 fluorescence intensity in EZ− and EZ+ spines. Arrowheads indicate median values. AFU, arbitrary fluorescence units.
Figure 3. Dynamin-3 Localizes to Spine Membrane Domains Lateral to the PSD
(A) Electron micrographs from adult rat CA1 hippocampus indicating immunogold labeling for dynamin-3 (arrows). Dynamin-3 localizes to lateral spine membranes domains. S, spine; T, presynaptic terminal. Scale bars, 200 nm. (B) Quantitative analysis of dynamin-3 immunogold particle density associated with the spine membrane plotted against tangential distance normalized by spine size (see inset). See Experimental Procedures for details.
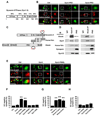
Figure 4. A Dyn3-Homer-Shank Protein Complex Couples the EZ and the PSD
(A) Schematic diagram of dynamin family GTPases illustrating their domain organization. The percent amino acid conservation between dynamins 1–3 for each separate protein domain is indicated. PH, pleckstrin homology domain; GED, GTPase effector domain; PRD, proline-rich domain. Bottom numbers are amino acid positions corresponding to dynamin-3. (B) Expression of Dyn3-PRD uncouples the EZ from the PSD. Images are of hippocampal neurons expressing PSD-95-GFP and clathrin-DsRed together with the indicated Flag-tagged dynamin constructs. Right panels correspond to regions in the dashed white boxes. Scale bars, 2 µm and 1 µm. (C) Schematic representation of protein interactions linking dynamin-3, Homer1b/c, and Shank. PH, pleckstrin homology domain; GED, GTPase effector domain; PRD, proline-rich domain; EVH1, Ena/Vasp homology domain 1;
P
XX
F
, consensus EVH1-binding motifs; Ank, ankyrin repeats; PDZ, PSD-95/discs-large/ZO-1 homology domain; SAM, sterile alpha motif. (D) Dynamin-3 forms a complex with Homer and Shank in rat brain. Immunoprecipitations (IP) were performed with antibodies against either dynamin-3 (Dyn3) or Shank or with control IgG and precipitated proteins subjected to immunoblot analysis (IB) for the indicated proteins. PNS, postnuclear supernatant. (E) The Homer binding domain of dynamin-3 is required for PSD-EZ coupling. Images correspond to dendritic segments of hippocampal neurons expressing PSD-95-GFP (green) and clathrin-DsRed (red) along with either wildtype (Dyn3) or Homer-binding deficient mutant (Dyn3-P800L) dynamin-3 constructs. Scale bars, 2 µm and 1 µm. Arrowheads indicate EZ-negative PSD-95 puncta. (F) Quantitative analysis of PSD-associated endocytic machinery. Data represent means ± SEM of the fraction of synapses lacking a clathrin-DsRed punctum within 0.7 µm (EZ-negative synapses) on hippocampal neurons expressing the indicated constructs. n = 134, 15, 20, 34, 27, 16, and 20 from left to right; ** p < 0.001 relative to control, t-test. (**G**) Disruption of Homer and Shank interactions causes loss of the spine EZ. Data represent means ± SEM of the fraction of EZ-negative synapses on hippocampal neurons expressing the indicated constructs. n = 134, 37, 12, and 21 from left to right; ** p < 0.001 relative to control, t-test. (**H**) GTPase-deficient mutant dynamins do not affect clathrin localization adjacent to the PSD. Data and analysis as in (F) and (G). n = 20, 15, 12, and 16, respectively; p > 0.05 relative to control, t-test.
Figure 5. Oligomerization of Dynamin-3 is Required to Link the Endocytic Machinery to the PSD
(A) Schematic diagram of wild type and deletion mutant constructs of dynamin-3. PH, pleckstrin homology domain; GED, GTPase effector domain; PRD, proline-rich domain. (B) Dynamin-3 forms both homo- and hetero-oligomers in HEK 293T cells. HEK 293T cells were co-transfected with Flag- and GFP-tagged dynamin-2 or dynamin-3. Immunoprecipitations (IP) were performed with an antibody against the Flag epitope and precipitated proteins subjected to immunoblot analysis (IB) for the indicated proteins. Inputs represent lysates used for IPs. Molecular mass in kilodaltons is shown at the right. The arrowhead indicates immunoprecipitated GFP-dynamin. The asterisk indicates a non-specific band. (C) Expression of the oligomerization-deficient dynamin-3 mutant Dyn3-ΔGED uncouples the EZ from the PSD. Images are of hippocampal neurons expressing either Dyn3-ΔGED or GFP together with clathrin-DsRed. Cells were fixed and stained for the excitatory synapse marker VGLUT1. Right panels correspond to regions in the dashed white boxes. Scale bars, 5 µm and 1 µm. Arrowheads indicate EZ-negative VGLUT1 puncta. (D) Quantification of EZ-negative synapses in neurons expressing Dyn3-ΔGED or GFP control. Data represent means ± SEM. n = 14, 8; ** p < 0.001 relative to GFP, t-test.
Figure 6. Endogenous Dynamin-3 is Required for Postsynaptic Positioning of the Endocytic Zone
(A) Dynamin-3 knock-down causes loss of the EZ. Hippocampal neurons expressing either dynamin-3 shRNA (d3RNAi-2) or a scrambled shRNA control (scramble) together with clathrin-DsRed were fixed and stained for VGLUT1. Scale bar, 5 µm. (B) High magnification views of glutamatergic synapses (VGLUT1, green) and postsynaptic clathrin (clathrin-DsRed, red). Postsynaptic neurons expressed the indicated shRNA constructs. Scale bar, 1 µm. (C) Quantification of endocytic zone (EZ) negative synapses in neurons expressing dynamin-3 shRNAs (d3RNAi-2, d3RNAi-4), dynamin-2 shRNA (d2RNAi-2) or a scrambled RNAi control. Co-expression of RNAi-resistant dynamin-3 cDNAs (Dyn3-2*, Dyn3–4*, Dyn3–4*-P800L, Dyn3-ΔGED) is indicated. Data are means ± SEM. n = 36, 41, 40, 13, 18, 25, 11 and 16, respectively; ** p < 0.001 relative to scrambled shRNA control, t-test.
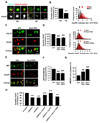
Figure 7. Uncoupling the EZ from the PSD Causes Loss of Synaptic AMPA Receptors
(A) AMPA receptors are more abundant in spines containing an EZ. Synaptic AMPA receptors on hippocampal neurons were visualized by surface GluR1 (sGluR1) staining. Spines containing (EZ+) or lacking (EZ−) an EZ were defined by the presence or absence of clathrin-DsRed. VGLUT1 was used to mark glutamatergic synapses. Scale bar, 1 µm. Dashed circles indicate regions selected for intensity measurement. (B) Quantification of GluR1 in spines that contain (EZ+) or lack (EZ−) an EZ. Left, means ± SEM of surface GluR1 fluorescence intensity. n = 14 neurons, EZ+, 1635 synapses; EZ−, 319 synapses; ** p < 0.001 relative to EZ+ spines, t-test. Right, histogram analysis of surface GluR1 fluorescence intensity in EZ− and EZ+ spines. Arrowheads indicate median values. (C) Disruption of the EZ decreases synaptic AMPA receptors. Endogenous surface GluR1 (sGluR1) and VGLUT1 were visualized by immunostaining of hippocampal neurons expressing either GFP or Dyn3-PRD. Arrowheads indicate synapses with undetectable levels of surface GluR1. Scale bar, 2 µm. (D) Quantification of GluR1 at synapses expressing the indicated constructs. Left, means ± SEM of surface GluR1 fluorescence intensity. n = 20, 31, and 21, ** p < 0.001 relative to GFP, t-test. Right, histogram analysis of surface GluR1 fluorescence. Arrowheads indicate median values. (E) Disruption of the EZ does not affect synaptic NMDA receptors. Endogenous surface GluR1 (sGluR1) and NR1 were visualized by immunostaining of hippocampal neurons (DIV 14–20) expressing either GFP or Dyn3-PRD. Arrowheads indicate synapses with little to no detectable GluR1, but which still contain NR1. Scale bar, 5 µm. (F) Data represent means ± SEM of the normalized surface GluR1 (AMPAR) to NR1 (NMDAR) ratio at synapses on hippocampal neurons expressing the indicated constructs. n = 15, 16, and 11; ** p < 0.001, t-test. (G) Quantification of NMDA receptor (NMDAR)-only synapses. ** p < 0.001 relative to GFP control, t-test. Error bars indicate SEM. (H) Quantification of surface synaptic GluR1 on neurons expressing dynamin-3 shRNAs (d3RNAi-2, d3RNAi-4) or a scrambled RNAi control. Co-expression of RNAi-resistant dynamin-3 cDNAs (Dyn3-2*, Dyn3–4*, Dyn3–4*-P800L) is indicated. Data are means ± SEM. n values are 58, 36, 43, 19, 24, 16 and 19; ** p < 0.001 relative to scrambled RNAi control, ## p < 0.001 relative to corresponding RNAi construct; t-test.
Figure 8. Disrupting the EZ Attenuates Excitatory Synaptic Transmission
(A) Representative traces showing AMPA receptor-mediated miniature excitatory postsynaptic currents (mEPSCs) recorded at DIV 17–24 from a control GFP-expressing hippocampal neuron (upper trace) and neurons expressing Dyn3-PRD, Dyn3-P800L, and d3RNAi-2. (B–C) Quantitative analysis of mEPSC amplitudes (B) and frequencies (C). Data represent means ± SEM. n values are 20, 18, 20, 19, 16, 14, 15 and 13, respectively. ** p < 0.001 relative to control; t-test.
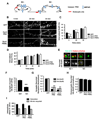
Figure 9. Uncoupling the EZ from the PSD Impairs Local Synaptic Recycling
(A) Proposed model for synaptic AMPA receptor endocytosis and recycling at synapses containing (EZ+) or lacking (EZ−) a PSD-associated EZ. The presence of an EZ ensures recapture of AMPA receptors (AMPARs) by localized recycling. Absent an EZ, AMPA receptors released from the PSD diffuse away from the synapse. (B) Disruption of the dynamin-3/Homer complex slows AMPA receptor endocytosis. Antibody-based endocytosis assays were performed on hippocampal neurons expressing either EGFP, Dyn3-PRD or Dyn3-P800L (14–20 DIV) and internalized GluR1 was visualized at the indicated time points. See Experimental Procedures for details. Scale bar, 5 µm. (C) Quantification of the results in (B). Data represent means ± SEM of internalized GluR1 at various times after incubation at 37°C normalized to total surface-labeled receptor at time zero. GFP, n = 17, 20 and 20; Dyn3-PRD, n = 20, 20 and 19; Dyn3-P800L, n = 20, 15 and 20; * p < 0.05, ** p< 0.001, comparisons between cells expressing EGFP and cells expressing Dyn3 constructs, unpaired t-test. (**D**) Transferrin (Tf) endocytosis is unaltered in neurons expressing Dyn3-PRD or Dyn3-P800L. Data represent means ± SEM of internalized Alexa-Tf at various times after incubation at 37°C normalized to total surface-labeled receptor at time zero. (**E**) Reduced recycling of GluR1 at EZ-negative synapses. Hippocampal neurons (14–20 DIV) co-expressing HA-GluR1 and clathrin-DsRed were incubated live with an anti-HA antibody at 10°C for 20 min followed by incubation at 37°C for 30 min to allow endocytosis. Remaining surface HA-GluR1 was blocked with unlabeled mouse secondary antibody. Neurons were then incubated for 1 hr at 37°C to allow recycling of internalized receptors. After fixation, recycled AMPA receptors on the surface were detected with Alexa568-conjugated secondary antibody. Glutamatergic synapses were labeled following permeabilization by staining for VGLUT1. Synapses lacking postsynaptic clathrin (EZ−) had less recycled GluR1, even when immediately next to an EZ-positive (EZ+) synapses (arrowhead). See Experimental Procedures for details. Scale bar, 1 µm. (**F**) Data represent means ± SEM of recycled HA-GluR1 at EZ-positive (EZ+) and EZ-negative (EZ−) synapses. EZ+, 156 synapses; EZ−, 124 synapses; ** p < 0.001, unpaired t-test. (**G**) Disrupting dynamin-3 binding to Homer prevents AMPA receptor synaptic recycling. Live antibody feeding and receptor recycling assays were performed as in (E) on hippocampal neurons expressing GFP, Dyn3-PRD, or Dyn3-P800L as indicated. Data represent means ± SEM of recycled HA-GluR1 or HA-GluR2 at VGLUT-positive synapses. n = 16, 12 and 14 for HA-GluR1; n = 9, 7 and 7 for HA-GluR2; ** p < 0.001, t-test. (**H**) Extrasynaptic GluR2 recycling is unaltered in neurons expressing dynamin-3 mutants. Data represent means ± SEM of recycled HA-GluR2 fluorescence at extrasynaptic dendritic regions. n = 9, 7, 7; p > 0.05 relative to control, t-test. (I) Neither uptake nor recycling of Tf is affected by disrupting the dynamin-3/Homer interaction. Hippocampal neurons expressing GFP, Dyn3-PRD, or Dyn3-P800L were incubated with Alexa-Tf for 60 min to allow saturating uptake (Saturation) followed by wash out and incubation with excess unlabeled transferrin (60 min recycled). Loss of internalized Tf fluorescence reflects recycling. See Experimental Procedures for details.
Comment in
- Retaining synaptic AMPARs.
Jaskolski F, Martin S, Henley JM. Jaskolski F, et al. Neuron. 2007 Sep 20;55(6):825-7. doi: 10.1016/j.neuron.2007.09.004. Neuron. 2007. PMID: 17880887 Free PMC article.
Similar articles
- Retaining synaptic AMPARs.
Jaskolski F, Martin S, Henley JM. Jaskolski F, et al. Neuron. 2007 Sep 20;55(6):825-7. doi: 10.1016/j.neuron.2007.09.004. Neuron. 2007. PMID: 17880887 Free PMC article. - The X-linked mental retardation protein OPHN1 interacts with Homer1b/c to control spine endocytic zone positioning and expression of synaptic potentiation.
Nakano-Kobayashi A, Tai Y, Nadif Kasri N, Van Aelst L. Nakano-Kobayashi A, et al. J Neurosci. 2014 Jun 25;34(26):8665-71. doi: 10.1523/JNEUROSCI.0894-14.2014. J Neurosci. 2014. PMID: 24966368 Free PMC article. - Endocytic trafficking and recycling maintain a pool of mobile surface AMPA receptors required for synaptic potentiation.
Petrini EM, Lu J, Cognet L, Lounis B, Ehlers MD, Choquet D. Petrini EM, et al. Neuron. 2009 Jul 16;63(1):92-105. doi: 10.1016/j.neuron.2009.05.025. Neuron. 2009. PMID: 19607795 Free PMC article. - Postsynaptic density scaffolding proteins at excitatory synapse and disorders of synaptic plasticity: implications for human behavior pathologies.
de Bartolomeis A, Fiore G. de Bartolomeis A, et al. Int Rev Neurobiol. 2004;59:221-54. doi: 10.1016/S0074-7742(04)59009-8. Int Rev Neurobiol. 2004. PMID: 15006490 Review. - [Scaffold proteins (MAGUK, Shank and Homer) in postsynaptic density in the central nervous system].
Beresewicz M. Beresewicz M. Postepy Biochem. 2007;53(2):188-97. Postepy Biochem. 2007. PMID: 17969881 Review. Polish.
Cited by
- Mechanics of dynamin-mediated membrane fission.
Morlot S, Roux A. Morlot S, et al. Annu Rev Biophys. 2013;42:629-49. doi: 10.1146/annurev-biophys-050511-102247. Annu Rev Biophys. 2013. PMID: 23541160 Free PMC article. Review. - Unified quantitative model of AMPA receptor trafficking at synapses.
Czöndör K, Mondin M, Garcia M, Heine M, Frischknecht R, Choquet D, Sibarita JB, Thoumine OR. Czöndör K, et al. Proc Natl Acad Sci U S A. 2012 Feb 28;109(9):3522-7. doi: 10.1073/pnas.1109818109. Epub 2012 Feb 13. Proc Natl Acad Sci U S A. 2012. PMID: 22331885 Free PMC article. - Nanoscale Sub-Compartmentalization of the Dendritic Spine Compartment.
Vallés AS, Barrantes FJ. Vallés AS, et al. Biomolecules. 2021 Nov 15;11(11):1697. doi: 10.3390/biom11111697. Biomolecules. 2021. PMID: 34827695 Free PMC article. Review. - BRAG2a Mediates mGluR-Dependent AMPA Receptor Internalization at Excitatory Postsynapses through the Interaction with PSD-95 and Endophilin 3.
Fukaya M, Sugawara T, Hara Y, Itakura M, Watanabe M, Sakagami H. Fukaya M, et al. J Neurosci. 2020 May 27;40(22):4277-4296. doi: 10.1523/JNEUROSCI.1645-19.2020. Epub 2020 Apr 27. J Neurosci. 2020. PMID: 32341099 Free PMC article. - Glutamate receptor dynamics in dendritic microdomains.
Newpher TM, Ehlers MD. Newpher TM, et al. Neuron. 2008 May 22;58(4):472-97. doi: 10.1016/j.neuron.2008.04.030. Neuron. 2008. PMID: 18498731 Free PMC article. Review.
References
- Baron MK, Boeckers TM, Vaida B, Faham S, Gingery M, Sawaya MR, Salyer D, Gundelfinger ED, Bowie JU. An architectural framework that may lie at the core of the postsynaptic density. Science. 2006;311:531–535. - PubMed
- Blanpied TA, Scott DB, Ehlers MD. Dynamics and regulation of clathrin coats at specialized endocytic zones of dendrites and spines. Neuron. 2002;36:435–449. - PubMed
- Brown TC, Tran IC, Backos DS, Esteban JA. NMDA receptor-dependent activation of the small GTPase Rab5 drives the removal of synaptic AMPA receptors during hippocampal LTD. Neuron. 2005;45:81–94. - PubMed
Publication types
MeSH terms
Substances
Grants and funding
- R01 NS047574-03/NS/NINDS NIH HHS/United States
- R01 NS047574-01A2/NS/NINDS NIH HHS/United States
- R01 NS039402-08/NS/NINDS NIH HHS/United States
- R01 AG024492-01/AG/NIA NIH HHS/United States
- R01 AG024492/AG/NIA NIH HHS/United States
- R01 NS047574/NS/NINDS NIH HHS/United States
- R01 AG024492-04/AG/NIA NIH HHS/United States
- R01 AG024492-03/AG/NIA NIH HHS/United States
- R01 AG024492-02/AG/NIA NIH HHS/United States
- R01 NS039402-09/NS/NINDS NIH HHS/United States
- R01 NS039402-07/NS/NINDS NIH HHS/United States
- R01 NS047574-02/NS/NINDS NIH HHS/United States
- R01 NS047574-04/NS/NINDS NIH HHS/United States
- R01 NS039402/NS/NINDS NIH HHS/United States
- R01 AG024492-05/AG/NIA NIH HHS/United States
LinkOut - more resources
Full Text Sources
Other Literature Sources
Molecular Biology Databases


