Target-specific requirements for enhancers of decapping in miRNA-mediated gene silencing - PubMed (original) (raw)
. 2007 Oct 15;21(20):2558-70.
doi: 10.1101/gad.443107. Epub 2007 Sep 27.
Affiliations
- PMID: 17901217
- PMCID: PMC2000321
- DOI: 10.1101/gad.443107
Target-specific requirements for enhancers of decapping in miRNA-mediated gene silencing
Ana Eulalio et al. Genes Dev. 2007.
Abstract
microRNAs (miRNAs) silence gene expression by suppressing protein production and/or by promoting mRNA decay. To elucidate how silencing is accomplished, we screened an RNA interference library for suppressors of miRNA-mediated regulation in Drosophila melanogaster cells. In addition to proteins known to be required for miRNA biogenesis and function (i.e., Drosha, Pasha, Dicer-1, AGO1, and GW182), the screen identified the decapping activator Ge-1 as being required for silencing by miRNAs. Depleting Ge-1 alone and/or in combination with other decapping activators (e.g., DCP1, EDC3, HPat, or Me31B) suppresses silencing of several miRNA targets, indicating that miRNAs elicit mRNA decapping. A comparison of gene expression profiles in cells depleted of AGO1 or of individual decapping activators shows that approximately 15% of AGO1-targets are also regulated by Ge-1, DCP1, and HPat, whereas 5% are dependent on EDC3 and LSm1-7. These percentages are underestimated because decapping activators are partially redundant. Furthermore, in the absence of active translation, some miRNA targets are stabilized, whereas others continue to be degraded in a miRNA-dependent manner. These findings suggest that miRNAs mediate post-transcriptional gene silencing by more than one mechanism.
Figures
Figure 1.
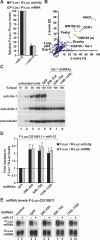
A genome-wide RNAi screen reveals a role for Ge-1 in miRNA-mediated gene silencing. (A) S2 cells were transfected with a mixture of plasmids containing the F-Luc-CG10011 reporter, a plasmid expressing miR-12 (+miR-12) or the corresponding empty vector (−miR-12), and a plasmid expressing Renilla luciferase (R-Luc). Firefly luciferase activity (black bars) and mRNA levels (gray bars) are normalized to that of the Renilla luciferase and set to 100 in cells transfected with the empty vector. Mean values ± standard deviations from three independent experiments are shown. (B) The results of the RNAi screen are represented as _z_-scores of two independent screens (see Materials and Methods). (Blue dots) Individual dsRNAs in the library; (red diamonds) components of the miRNA pathway; (green dot) Ge-1 (CG6181); (dashed red line) cutoff used (average _z_-score > 10). (C–E) S2 cells were treated with the indicated dsRNAs on days 0 and 4. On day 6, cells were transfected with the mixture of plasmids described in A. (C) The effectiveness of the depletions was analyzed by Western blotting, with the antibodies indicated on the left. In lanes 1–4, dilutions of untreated cells are loaded. Anti-tubulin antibodies were used as a loading control. Numbers above the lanes indicate the regions targeted by the dsRNAs and correspond to amino acids in the Ge-1 protein sequence. (D) Firefly luciferase activity (black bars) and mRNA levels (gray bars) are normalized to that of the Renilla luciferase. Furthermore, for each knockdown, the normalized values of F-Luc activity and mRNA levels in the presence of the miRNA are divided by those obtained in the absence of the miRNA. These ratios are set to unity in cells treated with GFP dsRNA. Mean values ± standard deviations from three independent experiments are shown. (E) Northern blot analysis of representative RNA samples isolated from S2 cells shown in D.
Figure 2.
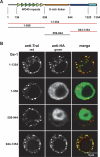
Ge-1 is a conserved component of metazoan P-bodies. (A) Domain architecture of Ge-1. (Dark-green triangles) Canonical WD40 repeats; (light-green triangles) divergent WD40 repeats; (yellow box) flexible linker rich in serines; (dark-blue box) C-terminal conserved domain; (cyan box) highly conserved motif. Numbers below the protein outline represent amino acid positions at fragment boundaries for the D. melanogaster protein. The protein domains sufficient for the localization to P-bodies are shown in red. (B) Confocal fluorescent micrograph of S2 cells expressing HA fusions of the Ge-1 domains indicated on the left. Cells were stained with anti-HA and affinity-purified anti-Tral antibodies. Bar, 5 μm.
Figure 3.
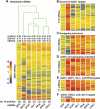
Expression profiles of D. melanogaster S2 cells depleted of AGO1 or decapping activators. (A) S2 cells were treated with the dsRNAs indicated below the lanes. The number (nb) of independent expression profiles obtained per depleted protein is indicated in brackets. Average expression levels of transcripts detectable in all profiles (5899 mRNAs) are shown. RNAs are represented as lines colored relative to their expression levels, as indicated on the left. Numbers above the lanes indicate rank correlation coefficients relative to AGO1, DCP1, or EDC3 as indicated. The experiment tree was calculated using the distance option in the GeneSpring software (Euclidean distance). (B) RNAs at least 1.5-fold overrepresented in the three independent profiles obtained for AGO1, and <1.5-fold up-regulated in at least nine of 10 profiles of decapping activators. (C) RNAs at least 1.5-fold overrepresented in the two profiles obtained for two or more decapping activators, and <1.5 up-regulated in the AGO1 knockdown. (D) mRNAs at least 1.5-fold overrepresented in the three independent profiles obtained for AGO1, and in the two profiles obtained for at least two decapping activators. (E) RNAs at least 1.5-fold overrepresented in the three independent profiles obtained for AGO1, and in five of six profiles obtained for DCP-1, Ge-1, and HPat. (F) RNAs at least 1.5-fold overrepresented in the three independent profiles obtained for AGO1 and in all profiles obtained for EDC3 and LSm1. Note that the lines representing individual mRNAs are compressed in A. The number of mRNAs displayed per panel is indicated on the left.
Figure 4.
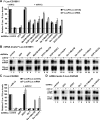
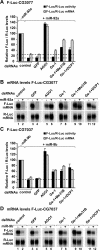
Decapping activators have partially redundant functions in silencing. (A–D) S2 cells were treated with the indicated dsRNAs on days 0 and 4. On day 6, cells were cotransfected with a mixture of plasmids expressing firefly luciferase (F-Luc) followed by the indicated 3′ UTRs, plasmids expressing miRNA primary transcripts (+miR-12) or the corresponding empty vector (−miR-12), and a plasmid expressing Renilla luciferase (R-Luc). (A,C) Firefly luciferase activity and mRNA levels are normalized to that of the Renilla luciferase. For each knockdown, the normalized values of F-Luc activity and mRNA levels are set to 100 in cells transfected with the empty vector (not shown except for control cells). Mean values ± standard deviations from three independent experiments are shown. (B,D) Northern blot analysis of representative RNA samples isolated from S2 cells shown in A and C, respectively.
Figure 5.
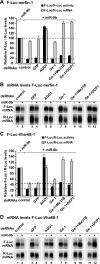
Decapping activators suppress silencing of miRNA targets regulated at the mRNA level. (A–D) S2 cells were treated with the indicated dsRNAs on days 0 and 4. On day 6, cells were transfected with a mixture of plasmids as described in Figure 4. Firefly luciferase activity and mRNA levels are analyzed as described in Figure 4. (B,D) Northern blot analysis of representative RNA samples isolated from S2 cells shown in A and C, respectively.
Figure 6.
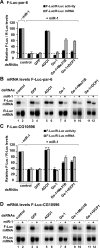
Decapping activators suppress silencing of miR-1 targets. (A–D) S2 cells were treated with the indicated dsRNAs on days 0 and 4. On day 6, cells were transfected with a mixture of plasmids as described in Figure 4. Firefly luciferase activity and mRNA levels are analyzed as described in Figure 4. (B,D) Northern blot analysis of representative RNA samples isolated from S2 cells shown in A and C, respectively.
Figure 7.
Decapping activators suppress silencing of miRNA targets regulated at the mRNA levels. (A–D) S2 cells were treated with the indicated dsRNAs on days 0 and 4. On day 6, cells were transfected with a mixture of plasmids as described in Figure 4. Samples are analyzed as described in Figure 4. (B,D) Northern blot analysis of representative RNA samples isolated from S2 cells shown in A and C, respectively.
Figure 8.
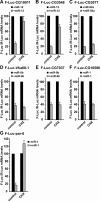
miRNAs elicit mRNA decay via translation-dependent and translation-independent mechanisms. (A–G) S2 cells were cotransfected with a mixture of plasmids as described in Figure 4. Cells were treated with cycloheximide (CHX) as indicated. Firefly luciferase mRNA levels are normalized to that of the Renilla luciferase. The normalized values of F-Luc mRNA are set to 100 in cells transfected with the empty vector (i.e., in the absence of the miRNA; black bars). Mean values ± standard deviations from three independent experiments are shown.
Similar articles
- mRNA degradation by miRNAs and GW182 requires both CCR4:NOT deadenylase and DCP1:DCP2 decapping complexes.
Behm-Ansmant I, Rehwinkel J, Doerks T, Stark A, Bork P, Izaurralde E. Behm-Ansmant I, et al. Genes Dev. 2006 Jul 15;20(14):1885-98. doi: 10.1101/gad.1424106. Epub 2006 Jun 30. Genes Dev. 2006. PMID: 16815998 Free PMC article. - MicroRNAs silence gene expression by repressing protein expression and/or by promoting mRNA decay.
Behm-Ansmant I, Rehwinkel J, Izaurralde E. Behm-Ansmant I, et al. Cold Spring Harb Symp Quant Biol. 2006;71:523-30. doi: 10.1101/sqb.2006.71.013. Cold Spring Harb Symp Quant Biol. 2006. PMID: 17381335 Review. - A crucial role for GW182 and the DCP1:DCP2 decapping complex in miRNA-mediated gene silencing.
Rehwinkel J, Behm-Ansmant I, Gatfield D, Izaurralde E. Rehwinkel J, et al. RNA. 2005 Nov;11(11):1640-7. doi: 10.1261/rna.2191905. Epub 2005 Sep 21. RNA. 2005. PMID: 16177138 Free PMC article. - miRISC recruits decapping factors to miRNA targets to enhance their degradation.
Nishihara T, Zekri L, Braun JE, Izaurralde E. Nishihara T, et al. Nucleic Acids Res. 2013 Oct;41(18):8692-705. doi: 10.1093/nar/gkt619. Epub 2013 Jul 17. Nucleic Acids Res. 2013. PMID: 23863838 Free PMC article. - Argonaute-mediated translational repression (and activation).
Iwasaki S, Tomari Y. Iwasaki S, et al. Fly (Austin). 2009 Jul-Sep;3(3):204-6. Epub 2009 Jul 14. Fly (Austin). 2009. PMID: 19556851 Review.
Cited by
- Novel modeling of combinatorial miRNA targeting identifies SNP with potential role in bone density.
Coronnello C, Hartmaier R, Arora A, Huleihel L, Pandit KV, Bais AS, Butterworth M, Kaminski N, Stormo GD, Oesterreich S, Benos PV. Coronnello C, et al. PLoS Comput Biol. 2012;8(12):e1002830. doi: 10.1371/journal.pcbi.1002830. Epub 2012 Dec 20. PLoS Comput Biol. 2012. PMID: 23284279 Free PMC article. - The RNA helicase DDX6 controls early mouse embryogenesis by repressing aberrant inhibition of BMP signaling through miRNA-mediated gene silencing.
Kim J, Muraoka M, Okada H, Toyoda A, Ajima R, Saga Y. Kim J, et al. PLoS Genet. 2022 Oct 5;18(10):e1009967. doi: 10.1371/journal.pgen.1009967. eCollection 2022 Oct. PLoS Genet. 2022. PMID: 36197846 Free PMC article. - Structural and molecular mechanisms for the control of eukaryotic 5'-3' mRNA decay.
Mugridge JS, Coller J, Gross JD. Mugridge JS, et al. Nat Struct Mol Biol. 2018 Dec;25(12):1077-1085. doi: 10.1038/s41594-018-0164-z. Epub 2018 Dec 5. Nat Struct Mol Biol. 2018. PMID: 30518847 Review. - microRNA-mediated messenger RNA deadenylation contributes to translational repression in mammalian cells.
Beilharz TH, Humphreys DT, Clancy JL, Thermann R, Martin DI, Hentze MW, Preiss T. Beilharz TH, et al. PLoS One. 2009 Aug 27;4(8):e6783. doi: 10.1371/journal.pone.0006783. PLoS One. 2009. PMID: 19710908 Free PMC article. - Concordant regulation of translation and mRNA abundance for hundreds of targets of a human microRNA.
Hendrickson DG, Hogan DJ, McCullough HL, Myers JW, Herschlag D, Ferrell JE, Brown PO. Hendrickson DG, et al. PLoS Biol. 2009 Nov;7(11):e1000238. doi: 10.1371/journal.pbio.1000238. Epub 2009 Nov 10. PLoS Biol. 2009. PMID: 19901979 Free PMC article.
References
- Bagga S., Bracht J., Hunter S., Massirer K., Holtz J., Eachus R., Pasquinelli A.E., Bracht J., Hunter S., Massirer K., Holtz J., Eachus R., Pasquinelli A.E., Hunter S., Massirer K., Holtz J., Eachus R., Pasquinelli A.E., Massirer K., Holtz J., Eachus R., Pasquinelli A.E., Holtz J., Eachus R., Pasquinelli A.E., Eachus R., Pasquinelli A.E., Pasquinelli A.E. Regulation by let-7 and lin-4 miRNAs results in target mRNA degradation. Cell. 2005;122:553–563. - PubMed
- Bartel D.P. MicroRNAs: Genomics, biogenesis, mechanism, and function. Cell. 2004;116:281–297. - PubMed
- Behm-Ansmant I., Rehwinkel J., Doerks T., Stark A., Bork P., Izaurralde E., Rehwinkel J., Doerks T., Stark A., Bork P., Izaurralde E., Doerks T., Stark A., Bork P., Izaurralde E., Stark A., Bork P., Izaurralde E., Bork P., Izaurralde E., Izaurralde E. mRNA degradation by miRNAs and GW182 requires both CCR4:NOT deadenylase and DCP1:DCP2 decapping complexes. Genes & Dev. 2006a;20:1885–1898. - PMC - PubMed
- Behm-Ansmant I., Rehwinkel J., Izaurralde E., Rehwinkel J., Izaurralde E., Izaurralde E. MicroRNAs silence gene expression by repressing protein expression and/or by promoting mRNA decay. Cold Spring Harb. Symp. Quant. Biol. 2006b;71:523–530. - PubMed
- Bhattacharyya S.N., Habermacher R., Martine U., Closs E.I., Filipowicz W., Habermacher R., Martine U., Closs E.I., Filipowicz W., Martine U., Closs E.I., Filipowicz W., Closs E.I., Filipowicz W., Filipowicz W. Relief of microRNA-mediated translational repression in human cells subjected to stress. Cell. 2006;125:1111–1124. - PubMed
Publication types
MeSH terms
Substances
LinkOut - more resources
Full Text Sources
Molecular Biology Databases
Research Materials
Miscellaneous
