Highly penetrant myeloproliferative disease in the Ts65Dn mouse model of Down syndrome - PubMed (original) (raw)
Highly penetrant myeloproliferative disease in the Ts65Dn mouse model of Down syndrome
Gina Kirsammer et al. Blood. 2008.
Abstract
Children with Down syndrome (DS) display macrocytosis, thrombocytosis, and a 500-fold increased risk of developing megakaryocytic leukemia; however, the specific effects of trisomy 21 on hematopoiesis remain poorly defined. To study this question, we analyzed blood cell development in the Ts65Dn mouse model of DS. Ts65Dn mice are trisomic for 104 orthologs of Hsa21 genes and are the most widely used mouse model for DS. We discovered that Ts65Dn mice display persistent macrocytosis and develop a myeloproliferative disease (MPD) characterized by profound thrombocytosis, megakaryocyte hyperplasia, dysplastic megakaryocyte morphology, and myelofibrosis. In addition, these animals bear distorted hematopoietic stem and myeloid progenitor cell compartments compared with euploid control littermates. Of the 104 trisomic genes in Ts65Dn mice, Aml1/Runx1 attracts considerable attention as a candidate oncogene in DS-acute megakaryoblastic leukemia (DS-AMKL). To determine whether trisomy for Aml1/Runx1 is essential for MPD, we restored disomy at the Aml1/Runx1 locus in the Ts65Dn strain. Surprisingly, trisomy for Aml1/Runx1 is not required for megakaryocyte hyperplasia and myelofibrosis, suggesting that trisomy for one or more of the remaining genes can promote this disease. Our studies demonstrate the potential of DS mouse models to improve our understanding of chromosome 21 gene dosage effects in human hematologic malignancies.
Figures
Figure 1
Ts65Dn mice develop megakaryocytic myeloproliferative disease. (A) Complete blood counts (CBCs) are altered in Ts65Dn peripheral blood in comparison with euploid littermate controls. MCV indicates mean corpuscular volume; RBC, red blood cells. n = 14 Ts65Dn; n = 22 euploid same sex littermates. P < .05 for all parameters at all time points. Complete actual values and statistics are provided in Table S2. Error bars represent SE. (B) Hematoxylin and eosin staining of bone marrow and spleen sections (left and middle panels, respectively) highlight megakaryocyte hyperplasia in Ts65Dn animals, while reticulin staining reveals bone marrow fibrosis (right panels). → indicate megakaryocytes; ➤ indicate reticulin fibrosis. All images were captured at 200× original magnification.
Figure 2
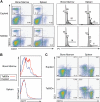
Representative flow cytometric analysis of bone marrow and spleen cells. (A) Ts65Dn mice harbor increased CD41+ cells in the bone marrow and spleen (left panels). CD41+ megakaryocytes from Ts65Dn animals show an increase in the lower ploidy classes in both organs (right panels). (B) Ts65Dn mice display increased c-kit expression in the bone marrow. (C) The ratio of CD19+ to CD3+ lymphocytes is diminished in Ts65Dn mice. Numbers on plots and on histogram peaks represent the percentage of the total population of cells in the rectangle.
Figure 3
Ts65Dn spleens harbor increased hematopoietic progenitors. Colony-forming assays were performed using nucleated bone marrow cells or splenocytes isolated from Ts65Dn mice and euploid littermate controls.  indicate euploid controls;
  indicate Ts65Dn. BFU-E indicates erythroid burst-forming unit; CFU-GM, granulocyte-macrophage colony-forming unit; and CFU-MK, megakaryocyte colony-forming unit. n = 3 Ts65Dn; n = 3 euploid littermates. Differences in spleen colony number are P = .1 for CFU-MKs, P = .24 for CFU-GMs, and P = .6 for BFU-Es. Error bars represent SE.
Figure 4
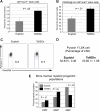
LSK and myeloid progenitor cell profiles are distorted in Ts65Dn bone marrow. (A) LSK (lineage−, Sca1+, c-kit+) and myeloid progenitor (lineage−, Sca1−, c-kit+) compartments were analyzed in lineage-depleted bone marrow by flow cytometry. Ts65Dn mice displayed an increased percentage of LSK cells. (B) LSK cells stain more brightly for CD34 in Ts65Dn mice. (C) Analysis of myeloid progenitors demonstrates a bias toward the GMP compartment (granulocyte-monocyte progenitor; lineage−, c-kit+, Sca1−, CD34+, FcγR+) and away from the MEP compartment (megakaryocyte-erythrocyte progenitor; lineage−, c-kit+, Sca1−, CD34−, FcγR−). (D) Representative analysis of quiescent LSK cells in Ts65Dn and control bone marrow by pyronin Y/Hoechst staining. Pyronin Y–low cells represent the quiescent LSK fraction. (E) Average values and statistical analysis of quiescent LSK cells in bone marrow. n = 3 Ts65Dn; n = 3 controls. P = .01. Numbers on plots represent the percentage of the total population of cells in the rectangle.
Figure 5
Ts65Dn bone marrow displays signs of disease by 3 months of age. (A) Three- to 4-month-old Ts65Dn mice harbor a larger LSK cell compartment compared with euploid controls. n = 9 Ts65Dn; n = 9 euploid controls. (B) Bone marrow LSK cells express more CD34 in young Ts65Dn mice. (C) Representative pyronin Y/Hoechst staining of Ts65Dn LSK cells shows that they are more transcriptionally active than controls. Numbers on plots represent the percentage of the total population of cells in the rectangle. (D) Average values and statistical analysis of quiescent LSK cells in bone marrow. n = 3 Ts65Dn; n = 3 controls. P = .001. (E) Young Ts65Dn mice display a trend toward increased megakaryocyte progenitors in the spleen.  represent euploid controls;
  represent Ts65Dn. n = 9 Ts65Dn; n = 9 controls. Error bars represent SE.
Figure 6
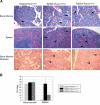
Three alleles of Aml1/Runx1 are not essential for the development of MPD. (A) Hematoxylin and eosin staining of bone marrow and spleen (top 2 panels) and bone marrow reticulin staining (bottom panels) demonstrate that Ts65Dn mice with 3 or 2 alleles of Runx1 (Ts65Dn/Runx1+/+/+ and Ts65Dn/Runx1+/+/−, respectively) develop a similar phenotype. (B) In vitro colony-forming assays demonstrate that restoring disomy at the Runx1 locus does not abrogate extramedullary hematopoiesis in Ts65Dn. Runx1 trisomy may contribute to the extent of extramedullary megakaryopoiesis. Error bars represent SE.
Similar articles
- Mouse models of Down syndrome: gene content and consequences.
Gupta M, Dhanasekaran AR, Gardiner KJ. Gupta M, et al. Mamm Genome. 2016 Dec;27(11-12):538-555. doi: 10.1007/s00335-016-9661-8. Epub 2016 Aug 18. Mamm Genome. 2016. PMID: 27538963 Free PMC article. Review. - Trisomy of Erg is required for myeloproliferation in a mouse model of Down syndrome.
Ng AP, Hyland CD, Metcalf D, Carmichael CL, Loughran SJ, Di Rago L, Kile BT, Alexander WS. Ng AP, et al. Blood. 2010 May 13;115(19):3966-9. doi: 10.1182/blood-2009-09-242107. Epub 2009 Dec 9. Blood. 2010. PMID: 20007548 - Early lineage priming by trisomy of Erg leads to myeloproliferation in a Down syndrome model.
Ng AP, Hu Y, Metcalf D, Hyland CD, Ierino H, Phipson B, Wu D, Baldwin TM, Kauppi M, Kiu H, Di Rago L, Hilton DJ, Smyth GK, Alexander WS. Ng AP, et al. PLoS Genet. 2015 May 14;11(5):e1005211. doi: 10.1371/journal.pgen.1005211. eCollection 2015 May. PLoS Genet. 2015. PMID: 25973911 Free PMC article. - Increased dosage of the chromosome 21 ortholog Dyrk1a promotes megakaryoblastic leukemia in a murine model of Down syndrome.
Malinge S, Bliss-Moreau M, Kirsammer G, Diebold L, Chlon T, Gurbuxani S, Crispino JD. Malinge S, et al. J Clin Invest. 2012 Mar;122(3):948-62. doi: 10.1172/JCI60455. Epub 2012 Feb 22. J Clin Invest. 2012. PMID: 22354171 Free PMC article. - Developmental instability of the cerebellum and its relevance to Down syndrome.
Shapiro BL. Shapiro BL. J Neural Transm Suppl. 2001;(61):11-34. doi: 10.1007/978-3-7091-6262-0_2. J Neural Transm Suppl. 2001. PMID: 11771737 Review.
Cited by
- Down syndrome-associated leukaemias: current evidence and challenges.
Mason NR, Cahill H, Diamond Y, McCleary K, Kotecha RS, Marshall GM, Mateos MK. Mason NR, et al. Ther Adv Hematol. 2024 Jul 23;15:20406207241257901. doi: 10.1177/20406207241257901. eCollection 2024. Ther Adv Hematol. 2024. PMID: 39050114 Free PMC article. Review. - Breathing and Oxygen Carrying Capacity in Ts65Dn and Down Syndrome.
DeRuisseau LR, Receno CN, Cunningham C, Bates ML, Goodell M, Liang C, Eassa B, Pascolla J, DeRuisseau KC. DeRuisseau LR, et al. Function (Oxf). 2023 Oct 6;4(6):zqad058. doi: 10.1093/function/zqad058. eCollection 2023. Function (Oxf). 2023. PMID: 37954975 Free PMC article. - Synergistic roles of DYRK1A and GATA1 in trisomy 21 megakaryopoiesis.
Sit YT, Takasaki K, An HH, Xiao Y, Hurtz C, Gearhart PA, Zhang Z, Gadue P, French DL, Chou ST. Sit YT, et al. JCI Insight. 2023 Oct 31;8(23):e172851. doi: 10.1172/jci.insight.172851. JCI Insight. 2023. PMID: 37906251 Free PMC article. - RUN(X) out of blood: emerging RUNX1 functions beyond hematopoiesis and links to Down syndrome.
Rozen EJ, Ozeroff CD, Allen MA. Rozen EJ, et al. Hum Genomics. 2023 Sep 5;17(1):83. doi: 10.1186/s40246-023-00531-2. Hum Genomics. 2023. PMID: 37670378 Free PMC article. Review. - Dissection of a Down syndrome-associated trisomy to separate the gene dosage-dependent and -independent effects of an extra chromosome.
Xing Z, Li Y, Cortes-Gomez E, Jiang X, Gao S, Pao A, Shan J, Song Y, Perez A, Yu T, Highsmith MR, Boadu F, Conroy JM, Singh PK, Bakin AV, Cheng J, Duan Z, Wang J, Liu S, Tycko B, Yu YE. Xing Z, et al. Hum Mol Genet. 2023 Jun 19;32(13):2205-2218. doi: 10.1093/hmg/ddad056. Hum Mol Genet. 2023. PMID: 37014740 Free PMC article.
References
- Roizen NJ, Amarose AP. Hematologic abnormalities in children with Down syndrome. Am J Med Genet. 1993;46:510–512. - PubMed
- Kivivuori SM, Rajantie J, Siimes MA. Peripheral blood cell counts in infants with Down's syndrome. Clin Genet. 1996;49:15–19. - PubMed
- Gurbuxani S, Vyas P, Crispino JD. Recent insights into the mechanisms of myeloid leukemogenesis in Down syndrome. Blood. 2004;103:399–406. - PubMed
- Groet J, McElwaine S, Spinelli M, et al. Acquired mutations in GATA1 in neonates with Down's syndrome with transient myeloid disorder. Lancet. 2003;361:1617–1620. - PubMed
- Mundschau G, Gurbuxani S, Gamis AS, Greene ME, Arceci RJ, Crispino JD. Mutagenesis of GATA1 is an initiating event in Down syndrome leukemogenesis. Blood. 2003;101:4298–4300. - PubMed
Publication types
MeSH terms
Substances
LinkOut - more resources
Full Text Sources
Medical
Molecular Biology Databases


